


Financial Stability Review, May 2026
Foreword

At the turn of the year 2025-26, economic growth surprised on the upside while financial market sentiment remained strong despite high uncertainty. The war in the Middle East is now putting this resilience to the test. The conflict has disrupted the global supply of energy and other commodities, dented growth prospects, pushed energy prices up and, by extension, raised inflation. While the full impact of the war is unclear at this stage, the repercussions for the global economy and financial stability are becoming graver the longer it lasts. Also, cybersecurity risks and hybrid threats to critical infrastructure are rising in this complex geopolitical environment.
Financial market adjustments have been pervasive but, nevertheless, orderly so far. Despite initial declines, financial asset prices still look stretched by historical standards, all the more so when current geoeconomic stress and uncertainty are taken into account. This leaves markets vulnerable to sharp repricing, and non-bank financial institutions could amplify financial market swings if they were to occur. Unforeseen redemptions during drawdowns and margin calls in the context of surging volatility could challenge non-banks in general and open-ended corporate bond funds in particular, given their low liquidity buffers. While not a systemic concern for the euro area, private markets warrant close monitoring in light of the potential for a spillover of stresses from US markets.
On the positive side, euro area banks have benefited from a decade-long improvement in capital and liquidity buffers and, more recently, stronger profitability. That said, several risks lie ahead. While euro area banks have only limited direct exposure to the Middle East, potential second-round effects of the war could be material and affect banks’ exposures to energy-intensive and trade-reliant sectors. Cost-of-living pressure could also weaken households and thus the asset quality of consumer credit and mortgage portfolios. Calls to cushion vulnerable households and firms from the fallout from the war, on top of higher spending needs for defence, could strain public finances further in some highly indebted euro area countries.
This edition of the ECB’s Financial Stability Review also includes four special features. The first explores financial stability sentiment using advanced AI tools. The second examines the divergence between rising corporate insolvencies and low NPL ratios in the euro area. The third assesses the effects of macroprudential policies on household credit and house prices, and the fourth analyses the implications of stress in global private credit markets for euro area financial stability.
The Financial Stability Review is prepared with the involvement of the ESCB Financial Stability Committee, which assists the decision-making bodies of the ECB in the fulfilment of their tasks. It is intended to promote awareness of systemic risks among policymakers, the financial industry and the public at large, with the ultimate goal of promoting financial stability.
Luis de Guindos
Vice-President of the European Central Bank
Overview

Euro area financial stability outlook challenged by the materialisation of acute geopolitical risks
The unexpected outbreak of war in the Middle East has unleashed an adverse supply shock, with highly uncertain outcomes in the medium term. The global financial system and real economy had been remarkably resilient going into 2026, despite a series of uncertainty shocks. These included questions over Greenland’s sovereignty, the US military intervention in Venezuela, market concerns over central bank independence and renewed trade policy uncertainty after the Supreme Court’s decision to overturn US “reciprocal” tariffs. This resilience is now being tested by a major geoeconomic shock triggered by the war in the Middle East. Disruptions to shipping through the Strait of Hormuz and attacks on energy infrastructure have led to significant volatility in global oil markets (Chart 1, panel a), higher oil and gas prices, as well as some relatively orderly adjustments, given the size of the shock, in financial markets. This supply shock poses upside risks to inflation and downside risks to economic growth. It could also increase market volatility and challenge debt servicing capacities as financing costs rise. Survey-based consensus forecasts project a material near-term impact on inflation (Chart 1, panel b), driven by higher energy prices. While growth is also expected to slow, the medium-term implications remain contingent on both the intensity and duration of the shock.
Chart 1
The war in the Middle East sparked a surge in energy prices and upside risks to inflation, while heightening cyber threats and infrastructure risks
a) Geopolitical risk index and oil price volatility | b) Distribution of 2026 HICP inflation and real GDP growth forecasts for the euro area | c) Financial Times word count for cyberattacks and hybrid warfare |
|---|---|---|
(1 Jan. 2022-19 May 2026, indices) | (Feb. 2026, May 2026; probability densities) | (Jan. 2006-Apr. 2026; totals, 3-month moving averages) |
 |  |  |
Sources: Caldara and Iacoviello*, Bloomberg Finance L.P., Consensus Economics Inc., Financial Times and ECB calculations.
Notes: Panel a: the geopolitical risk index is a seven-day moving average, while oil price volatility reflects the CBOE Crude Oil Volatility Index. Panel b: the dashed lines represent values for average HICP and real GDP growth forecasts. HICP stands for Harmonised Index of Consumer Prices. Panel c: articles were retrieved from the Financial Times archive through a keyword search referring to multiple keywords capturing cyberattacks and hybrid warfare respectively. Results based on ECB calculations based on textual analysis of Financial Times journalism.
*) Caldara, D. and Iacoviello, M., “Measuring Geopolitical Risk”, American Economic Review, Vol. 112, No 4, April 2022, pp. 1194-1225.
Acute geoeconomic stress is being amplified by lingering uncertainty about global trade, international cooperation and cyber threats. While the war in the Middle East is the central theme shaping market sentiment, trade policy uncertainty persists and renewed spikes cannot be ruled out. Tariff announcements, pauses and reversals have become a structural feature of the global environment. Uncertainty surrounding the commitment of the US Administration to multilateral cooperation is also increasing the risk that policy shocks will disrupt the international order and spur geoeconomic and regulatory fragmentation around the globe. In addition, hybrid threats are adding to the risks facing the operating environment (Chart 1, panel c), especially if targeted at critical infrastructure. In fact, the possibility that cyberattacks will cause severe and widespread disruption is growing rapidly, as AI – especially newly emerging frontier models – enhances both the potential scope for, and the speed of, attacks staged by state and non-state actors alike. In an already highly complex geopolitical landscape, these additional layers of uncertainty increase the likelihood of more frequent and severe adverse tail events.
In this context, the euro area financial stability outlook is shaped by three closely intertwined risks. First, a further escalation in and/or more prolonged geopolitical tensions, along with growing concerns about the sustainability of public finances, could undermine financial market sentiment, potentially triggering an abrupt market sell-off and exposing sovereign vulnerabilities. Second, liquidity and leverage vulnerabilities in the non-bank financial intermediation (NBFI) sector, including opaque and interconnected private markets, could amplify any market stress through fire sales, increasing the risk of spillovers to other financial and economic sectors. Third, although euro area banks have been resilient to recent shocks, exposures to the NBFI sector, together with the effects of geopolitical tensions on the debt servicing capacity of borrowers, could expose credit, liquidity and funding vulnerabilities. The current highly uncertain geoeconomic environment is proving to be more prolonged than initially anticipated. In this context, the potential for these highly interconnected risks to materialise simultaneously, possibly amplifying each other further, increases the risks to financial stability.
Prolonged geopolitical tensions and lingering fiscal challenges could test financial market sentiment
Markets are adjusting to geopolitical conflicts and energy supply disruptions, as well as lingering concerns about AI disruption risk. Financial market trends have been shaped by two key forces since the previous edition of the Financial Stability Review was published. First, market concerns about potential AI disruption, where industrial transformation driven by AI could render existing business models and jobs obsolete, triggered sharp declines in some large technology firms’ stock prices and weakness in software-related stocks in early 2026. This had knock-on effects for private markets, indicating signs of growing differentiation within AI-exposed assets (Chart 2, panel a). Second, the war in the Middle East has disrupted global energy supply, which has led to sharp increases in oil and gas prices as well as adjustments in equity markets, disproportionately affecting countries dependent on energy imports. Credit spreads have seen a short-lived widening, and volatility has risen across most asset classes, especially commodities, while market-implied policy rate expectations have shifted up considerably (Chart 2, panel b). Nevertheless, overall market functioning has remained orderly, with broader optimism about AI-driven productivity gains supporting risk sentiment and investors pricing in a short-lived war in the Middle East. A sustained rise in energy prices might also weigh on the optimistic AI narrative, as AI infrastructure and data centres are highly energy-intensive and sensitive to persistent energy cost shocks.
Chart 2
Market sentiment has grown more volatile, with the focus shifting from AI disruption risk to energy pricing, monetary policy expectations and sovereign vulnerabilities
a) MSCI AI, software and energy indices | b) Market-implied interest rate expectations | c) Distribution of sovereign spreads versus Germany across the euro area |
|---|---|---|
(1 Dec. 2025-19 May 2026, indices: 1 Dec. 2025 = 100) | (Jan. 2026-May 2029, percentages) | (Nov. 2021-May 2026, basis points) |
 |  |  |
Sources: Bloomberg Finance L.P., LSEG and ECB calculations.
Notes: Panel c: spreads are based on daily data corresponding to Financial Stability Review publication dates. The latest observation is for 19 May 2026.
Financial markets remain vulnerable to sharp adjustments, owing to persistently high valuations and concentrated exposures. Following the initial repricing, equity and corporate bond markets mostly rebounded on account of strong earnings reports in the United States and market expectations for further positive news regarding geopolitical developments. Accordingly, equity valuations remain stretched by historical standards, and corporate bond risk premia are compressed globally, which could be challenged by the very high level of geopolitical and policy uncertainty. Consequently, there is a fair risk that financial market sentiment could deteriorate, as downside risks related to geopolitical, fiscal and macro-financial developments appear underestimated. Negative surprises – including sharply deteriorating outlooks for energy markets, inflation and growth, a re-escalation of trade tensions, sudden shifts in monetary policy expectations or intensifying market concerns about AI disruption risk – could trigger abrupt sentiment shifts, with spillovers across asset classes and regions. At the same time, market concentration among, and interconnection between, a handful of large US-based tech firms has risen further. This leaves global public equity markets − and increasingly also bond markets and private markets – sensitive to shocks emanating from individual firms, even though most of these firms continued meeting or surpassing earnings expectations.
Sovereign bond markets are a central transmission channel through which adverse shocks spill over globally, including to the euro area bond markets. Euro area sovereign bond markets face pressures from rising yields, a changing investor base and external fiscal risk spillovers. Sovereign yields have increased markedly across major advanced economies on account of higher term premia and renewed inflation concerns, resulting in higher sovereign debt service costs. Nonetheless, euro area sovereign bond markets have continued to function in an orderly manner. Spreads continue to be narrow, despite some early signs of divergence following the outbreak of the war in the Middle East (Chart 2, panel c). Changes in the demand from institutional investors for longer-dated debt, including in the context of the recent Dutch pension reform, have made issuance of shorter-dated securities more attractive while simultaneously increasing rollover risk (see Section 1.2). Also, the growing presence of more price-sensitive investors like hedge funds in euro area sovereign bond markets could amplify any abrupt repricing of sovereign risk. This could also raise the risk of spillovers to the funding costs of corporates and banks. A repricing of euro area sovereign risk could also be triggered by spillovers from global sovereign bond markets. US Treasuries have served as safe-haven assets since the outbreak of the war in the Middle East . Nonetheless, market concerns about US fiscal credibility as a result of persistently high fiscal deficits, expectations of higher debt service costs and high borrowing needs could lead to changing risk perceptions and a repricing of sovereign risk globally.
Fiscal expansion in a challenging geoeconomic environment, including the urgent need to expand defence spending, could strain public finances further. Fiscal fundamentals remain fragile in several euro area countries owing to long-term structural challenges related to digitalisation, low productivity growth, population ageing and climate change which add to existing imbalances. Additionally, higher energy prices in the context of the current geopolitical environment could multiply the broader calls for fiscal support measures aimed at cushioning the impact on vulnerable households and firms. This would come on top of the higher defence spending required to meet the recently revised NATO target. Persistently high deficits and debt levels limit the scarce fiscal space available to several euro area countries to respond effectively. Fiscal responses to the energy price shock, such as energy subsidies and price caps, have been relatively limited so far. Looking forward, any fiscal support needs to be temporary and targeted to avoid fuelling sustained inflationary pressures and further straining public finances. A more persistent disruption of energy supply and notably weaker growth could trigger a reassessment of sovereign risk by market participants.
Vulnerabilities among non-banks, including those active in private markets, could amplify financial market stress
Non-banks have proved largely resilient to the war in the Middle East but face risks from broad-based market downturns. The outbreak of conflict triggered flight-to-safety flows, with insurance corporations, pension funds and investment funds all reducing holdings in equities and bonds exposed to higher credit risk. Outflows from high-yield corporate bond funds were particularly strong (see Section 4.2), while fears of rising inflation led to a shift in fund flows from long-term bond funds into short-term and inflation-protected funds (Chart 3, panel a). Non-banks have to date navigated volatile market conditions without significant disruptions. However, additional outflows are likely if the macro-financial impact of the conflict proves to be more severe than currently anticipated by market participants. In this highly uncertain environment, sudden and correlated price drops in financial markets and spikes in volatility – potentially leading to margin calls – could quickly trigger liquidity stress.
Chart 3
Non-banks have proved resilient to the war in the Middle East, while private market risks add to their liquidity and leverage vulnerabilities
a) Global investment fund flows into European bonds | b) Global private credit fund redemptions | c) Euro area investment funds’ cash holdings and market volatility |
|---|---|---|
(16 Feb.-19 May 2026, percentages of total net assets) | (Q3 2025-Q1 2026; USD billions, indices: Q1 2025 = 100) | (Jan. 2015-Apr. 2026; percentages of total assets, index) |
 |  |  |
Sources: EPFR Global, company SEC filings, LSEG, ECB (BSI, IVF), Bloomberg Finance L.P. and ECB calculations.
Notes: Panel a: “Start of Middle East war” refers to 2 March 2026, the first trading day after the outbreak of the war in the Middle East on 28 February 2026. 0 on the x-axis marks the event date and other values indicate the business days before and after the event. Panel b: “Amounts honoured” and “Redemption requests” include data for a total of 26 non-traded business development companies (BDCs) that reported redemptions in the periods shown. Both indices are rebased to Q1 2025 = 100. Quarterly values correspond to the final business-day observation for each quarter. Panel c: “Euro area stock market volatility” refers to the EURO STOXX 50 Volatility Index (VSTOXX). The investment fund cash holdings series is available up to February 2026.
High portfolio valuations and concentrated exposures on non-banks’ balance sheets increase the risk of forced asset sales that could amplify market stress. Despite adjustments in bond and equity markets following the outbreak of the war in the Middle East, portfolio valuations of non-banks remain elevated by historical standards (see Section 4.1). Exposures continue to be heavily skewed towards US dollar-denominated assets, making the sector susceptible to US-specific shocks and exchange rate fluctuations. Vulnerabilities are being further compounded by the concentration of equity portfolios among a few large US issuers, especially AI‑related firms, for which valuations are closely tied to the continuation of a positive AI narrative. Sudden valuation losses could trigger spikes in liquidity needs and increase the risk of forced asset sales that amplify market stress.
While not a systemic concern per se in the euro area, opaque and interconnected private markets warrant close monitoring owing to spillover risks, especially from the United States. Given their complex leverage structures, opaque valuation practices and limited liquidity, private markets are prone to unforeseen and potentially abrupt valuation changes. Events in the United States since the start of 2026 have highlighted the associated risks, with open or semi-open private credit funds − such as business development companies heavily exposed to software and AI − facing sizeable redemption requests, often testing redemption gates to their limits (Chart 3, panel b). Private credit markets in the euro area remain relatively small despite their rapid growth in recent years. That said, the risks stemming from spillovers from the United States are significant (see Special Feature D). Direct spillovers, which are expected to be limited, could arise from euro area investors’ exposures to US private debt, potentially leading to losses and increased funding needs. More importantly, shifts in sentiment towards US private markets could indirectly affect euro area private markets regardless of underlying exposures. In this case, broader spillovers potentially could also affect some public markets, such as high-yield bonds (see Section 2.2). Growing ties between private markets and non-banks could amplify risks, with insurance corporations and pension funds being important investors in private markets in the euro area.
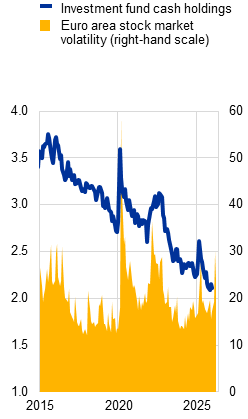
More broadly, structural liquidity and leverage vulnerabilities in the investment fund sector remain significant in this highly uncertain geopolitical environment. Inadequate liquidity buffers in times of heightened volatility (Chart 3, panel c) and liquidity mismatch in open-ended investment funds, especially in corporate bond and private credit funds, could exacerbate market volatility in times of stress through procyclical selling. Pockets of elevated financial and synthetic leverage in some entities, notably global hedge funds, may exacerbate the risk of financial contagion and expose liquidity vulnerabilities through margin calls when market volatility spikes. Although hedge funds remain a comparatively small subsector of euro area investment funds, it is a segment with a high concentration of potential leverage-related risks. Additionally, global hedge funds are highly active in European sovereign bond markets and could amplify price swings in times of sudden and substantial bond price movements.
Persistent liquidity and leverage vulnerabilities in the non-bank financial intermediation (NBFI) sector call for a comprehensive policy response. Recent stress episodes underscore the need to broaden monitoring and strengthen the policy framework for non-banks globally. Progress will depend on improved data availability and cross-border information-sharing, the timely implementation of internationally agreed reforms and the development of a more comprehensive toolkit for addressing risks from NBFI leverage that combines entity and activity-based measures. Data gaps are particularly acute in private markets, where concerns about opaque exposures and weak lending standards have intensified. At the EU level, stronger supervisory coordination, enhanced macroprudential powers to address risks related to liquidity mismatch and leverage, and system-wide stress testing would help reinforce resilience. In addition, accelerating progress on the savings and investments union – by deepening equity markets, mobilising savings and strengthening integrated supervision – will be essential to support growth and competitiveness while safeguarding financial stability.
Banks’ exposures to non-banks and vulnerable firms could expose credit, liquidity and funding vulnerabilities
Euro area banks have navigated recent bouts of uncertainty well, buoyed by strong profitability and ample capital and liquidity buffers. Their earnings have been consistently robust, with return on equity levels averaging close to 10% in 2025 albeit with persistent cross-country variation (see Section 3.1). Banks’ resilience has also been underpinned by capital and liquidity ratios well above regulatory requirements. Sound fundamentals and expectations of higher dividends supported a substantial increase in banks’ price-to-book valuations that started in early 2025 (see Box 3). However, rising concerns about their exposure to private markets and the potential of AI to disrupt their business models triggered a decline in bank stock valuations in early 2026 that continued after the war broke out in the Middle East. At the same time, bank bond yields have risen on the back of higher risk-free rates, although spreads have remained tight. These developments indicate that investors are adjusting for increased risks to bank earnings while not doubting the overall solvency of the sector.
Links with the NBFI sector expose euro area banks to credit, liquidity and funding vulnerabilities and could amplify market stress. In aggregate, euro area banks are net debtors to the NBFI sector, implying that bank-NBFI linkages could result in liquidity and funding vulnerabilities for banks (Chart 4, panel a). A significant portion of NBFI funding is tied to short-term maturities, exposing banks to rollover and redemption risks. Asset price shocks and liquidity shocks to non-banks could result in liquidity withdrawals from euro area banks. In response, banks may reduce lending to non-banks such as hedge funds, which would force these entities to liquidate trading positions. Even if bank exposures are collateralised and repo borrowing and lending positions are broadly balanced, losses could arise if non-banks are forced to deleverage into declining markets, triggering adverse price dynamics that also erode collateral values. In addition, euro area banks are exposed to private markets through direct lending to private market funds and lending to private market-backed firms. While direct lending is marginal, the opacity of financing structures of such investments, which often involve multiple layers of leverage, makes it difficult to assess the true level of risk for euro area banks.
Chart 4
Euro area banks have limited direct links to the Middle East but face credit, liquidity and funding risks from exposures to non-banks and trade- and energy-sensitive firms
a) Euro area banks’ assets and liabilities with non-banks | b) Total non-EU exposure of euro area banks, by region | c) Trade, energy and interest-rate sensitivity of euro area firms, by sector |
|---|---|---|
(Q4 2025, percentages of total assets) | (Q4 2025, percentages of total assets) | (Q4 2025, risk scores) |
 |  |  |
Sources: ECB (supervisory data), Eurostat and ECB (MNA), OECD, S&P Global Market Intelligence and ECB calculations.
Notes: Panel a: banks’ asset exposures to and funding from non-banks are ordered by their liquidity profile. Panel b: regional classification based on IMF world economic outlook groups, excluding all EU Member States. Panel c: economic sectors are ranked using the composite of the foreign market and foreign input reliance metric (see Avril et al.*) as well as the sectors’ energy output multipliers. Total energy output multipliers are the sum of direct and indirect cost shares calculated using the FIGARO symmetric input-output table for 2022. Results are broadly aggregated at NACE level 1 categories based on production weights. High values indicate a high reliance on either foreign markets or foreign inputs. The size of the bubbles indicates the share of gross value added in Q4 2025. Less interest rate-sensitive sectors are defined as economic sectors with an interest coverage ratio (ICR) below the median, where ICR is defined as earnings before interest and taxes (EBIT) divided by interest paid. Interest paid and EBIT are taken from Capital IQ for the period between Q1 2016 and Q2 2025. No information is available for the public administration sector. The red horizontal and vertical lines represent the median values across euro area sectors.
*) Avril, P. et al., “Risks to euro area financial stability from trade tensions”, Financial Stability Review, ECB, May 2025.
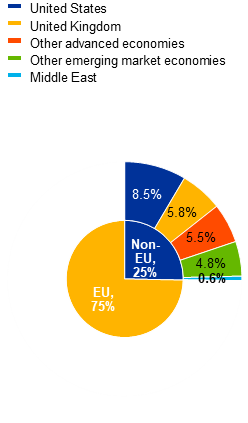
Euro area banks’ asset quality may deteriorate if macro-financial conditions worsen markedly as a result of the war in the Middle East. Euro area banks’ non-performing loan ratios remain close to historical lows in aggregate. However, some deterioration is evident in SME and consumer lending, with notable variation across countries (see Section 3.3). While corporate insolvencies have risen sharply in recent quarters, there is no evidence of a broad-based underestimation of corporate credit risk by banks (see Special Feature B). That said, asset quality risks could increase as the impact of the war in the Middle East unfolds. Banks’ direct exposures to the region are small, at around 0.6% of their total assets (Chart 4, panel b), and concentrated among a few banks. Nevertheless, a prolonged shock could have material second-round effects, especially for euro area firms operating in sectors that are simultaneously trade, energy and interest rate sensitive, such as manufacturing, wholesale and retail, or electricity (Chart 4, panel c). Rising energy prices and higher interest rates would exacerbate cost pressures, as would lingering tariff-related uncertainty and potential supply chain disruptions. Euro area households’ resilience could also be tested if stress in vulnerable parts of the corporate sector drives up unemployment. Furthermore, cost-of-living pressures from higher energy prices and inflation may weaken households’ debt servicing capacity, especially among lower-income groups. Banks could face higher provisioning costs as a result.
Preserving bank resilience remains a key priority for macroprudential policy in the context of elevated geopolitical and trade policy uncertainty. As such, releasable capital buffer requirements should be maintained to ensure headroom remains available to respond to severe shocks or bank capital constraints. Targeted increases in buffer rates might still be considered in countries with low releasable buffers, provided such measures do not pose procyclicality risks. At the same time, borrower-based measures should be used effectively to maintain sound lending standards (see Section 3.5). The prevailing regulatory and supervisory framework, including in the macroprudential remit, has been effective in safeguarding financial stability. There is, however, scope for making the framework more efficient and effective by reducing undue complexities, without compromising bank resilience. This is evidenced by the recommendations of the High-Level Task Force on Simplification and the European Commission’s broad simplification agenda, the main objective of which is to increase the competitiveness of European banks. Strengthening the banking union would be an important element in creating the conditions for euro area banks to operate effectively both within the EU and globally, supporting their resilience and competitiveness.
Euro area financial stability vulnerabilities remain elevated as the geoeconomic shock unfolds
All in all, the outlook for financial stability is being shaped by geoeconomic stress and energy supply disruptions, with the severity and duration of the fallout still uncertain. While markets have held up relatively well despite some adjustment, risk sentiment has been seen to wax and wane. Sentiment may deteriorate as the full impact of the war in the Middle East unfolds or as elevated asset valuations adjust to reflect prevailing geoeconomic uncertainty. Sudden market drawdowns could pose balance sheet challenges for euro area non-banks, given their persistent liquidity and leverage vulnerabilities, increasing the risk of fire sales. Opaque private markets could also be an additional source or amplifier of market downturns. Meanwhile, euro area banks could face pressures from exposures to trade- and energy-sensitive firms and from closer ties with non-banks, potentially crystalising credit, liquidity and funding vulnerabilities.
In addition, several cross-cutting structural challenges remain critical for financial stability, with the potential to amplify existing cyclical vulnerabilities. These include rising vulnerabilities associated with cybersecurity weaknesses and hybrid threats against critical infrastructure in an increasingly complex geopolitical landscape. Moreover, the rise of artificial intelligence, especially newly emerging frontier models, and quantum computing provide not only opportunities but also risks of destabilisation along the innovation path. Additionally, risks stemming from global regulatory fragmentation and deregulation, challenges linked to ageing populations and rising risks associated with climate change, including the materialisation of physical risks, remain significant concerns. The potential for these cyclical and structural vulnerabilities to crystalise simultaneously and amplify each other heightens the materiality of risks to euro area financial stability.
1 Macro-financial and credit environment

1.1 Trade fragmentation and energy supply disruptions are clouding the outlook for the euro area
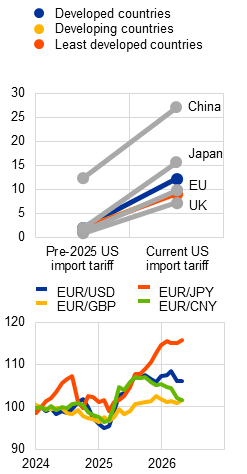
US trade policy has remained a persistent source of external headwinds for the euro area, with tariffs structurally higher than they were before 2025. The increase in US import tariffs across all trading partners points to a more durable shift in the global trade environment (Chart 1.1, panel a). However, the EU has not suffered as badly as some other developed economies, and at this stage there is only limited evidence that US tariffs have led to broad-based diversion of Chinese exports towards the euro area.[1] This has somewhat tempered the worst fears that euro area manufacturers could face intense competition, although pressure from China remains significant. Beyond tariffs, fluctuations between major currencies have not been a major additional driver of the euro area outlook since the previous edition of the Financial Stability Review was published. At the same time, the US dollar has acted as a safe haven and has appreciated against the euro recently, partly reflecting the euro area’s greater exposure to the energy shock.
Chart 1.1
The external environment has become more challenging as trade frictions and uncertainty are compounded by geopolitical risk
a) US import tariff rates and foreign exchange rates | b) Geopolitical risk and trade policy uncertainty index | c) Share of oil and gas imports from the Middle East |
|---|---|---|
(Jan. 2024-Apr. 2026; percentages, index: Jan. 2024 = 100) | (1 Jan. 2025-18 May 2026, indices) | (2025; percentages, ratio) |
 |  |  |
Sources: Bloomberg Finance L.P., UN Trade and Development (UNCTAD), trademap.org, International Trade Centre and ECB calculations.
Notes: Panel a: the UNCTAD dashboard tracks the direction and magnitude of tariff changes, by country and product group, faced by countries in the US market. Trade weights are for the year 2024. Panel b: the geopolitical risk index is derived from Caldara and Iacoviello*, while the trade policy uncertainty index is derived from Caldara et al.** Panel c: data refer to the 2025 US dollar value of imports derived from trademap.org on 31 March 2026. “Middle East” refers to Algeria, Bahrain, Djibouti, Egypt, Iran, Iraq, Jordan, Kuwait, Lebanon, Libya, Mauritania, Morocco, Oman, Qatar, Saudi Arabia, Somalia, Sudan, Syria, Tunisia, United Arab Emirates, West Bank and Gaza, and Yemen.
*) Caldara, D. and Iacoviello, M., “Measuring Geopolitical Risk”, American Economic Review, Vol. 112, No 4, April 2022, pp. 1194-1225.
**) Caldara, D., Iacoviello, M., Molligo, P., Prestipino, A. and Raffo, A., “The economic effects of trade policy uncertainty”, Journal of Monetary Economics, Vol. 109, 2020, pp. 38-59.
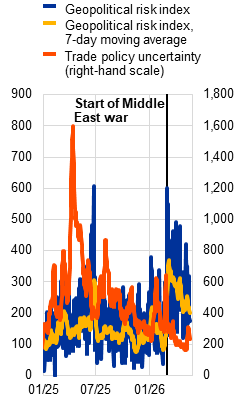
Macroeconomic conditions are increasingly being shaped by the combination of elevated trade policy uncertainty and broader geopolitical shocks. Before the outbreak of the war in the Middle East, trade policy uncertainty had eased from the peaks reached in the second quarter of 2025 (Chart 1.1, panel b). At the same time, the geopolitical risk environment has become increasingly challenging and fluid (see Box 1). The war in the Middle East has resulted in a further, sharp increase in geopolitical risk. It has involved attacks on energy infrastructure across the region, increasing the likelihood of more persistent disruptions to global energy supply.[2] The euro area is a net importer of energy and is therefore sensitive to disruptions in the Middle East through their impact on global energy prices, although it obtains less oil and gas from the region in relative terms than some other major economies (Chart 1.1, panel c).[3] The recent stress in the markets for refined petroleum products, particularly for jet fuel and diesel, highlights how dependence on energy imports remains a key vulnerability for the euro area.
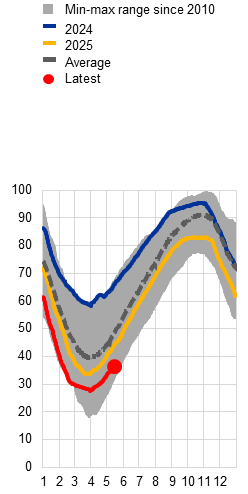
The euro area is facing significant energy supply disruption at a sensitive time, with gas reserves at historically low post-winter levels. The war in the Middle East has effectively closed the Strait of Hormuz, as reflected by the sharp fall in transit through this critical chokepoint (Chart 1.2, panel a). The near standstill in shipping has resulted in sharp increases in energy prices, while the backlog could also disrupt wider supply chains, with potentially systemic effects. The war could lead to lower growth in the euro area economy and globally, as higher energy costs weigh on real incomes, consumption and investment while keeping inflation elevated. These effects could become more persistent in the event of a prolonged war in the Middle East or further escalation, if transport routes and production facilities remain disrupted and oil and liquefied natural gas supply is restrained. In addition, the euro area is facing this shock with gas reserves needing to be rebuilt from historically low levels (Chart 1.2, panel b). The current situation could make replenishment more expensive and difficult, prolonging the period of elevated energy prices, adding to the drag on growth and pushing public debt dynamics in a less benign direction (see Section 1.2).
The euro area entered this adverse phase with some macroeconomic buffers in place that should help to cushion – but not fully offset – the fallout. Before the latest geopolitical escalation, domestic demand had been gradually improving, while the external sector had remained the main drag on growth (Chart 1.2, panel c). Sentiment was bolstered by a relatively firm global baseline, euro area growth in the fourth quarter of 2025 had exceeded expectations, and activity in the first quarter of 2026 was still expected to remain positive.[4] Investment was being supported by public defence and infrastructure spending, continued digital and AI-related investment and the crowding-in of private capital expenditure in the context of the European Commission’s Next Generation EU programme. Euro area inflation fell to 1.9% in February and was expected to increase to 2.6% in 2026 before falling back to around the ECB’s target of 2.0% after that, according to the baseline March ECB staff macroeconomic projections for the euro area.[5] At the same time, the growth outlook had also weakened, with euro area GDP growth for 2026 revised down by 0.3 percentage points. This baseline projection now appears increasingly benign, however, with risks tilted to the upside for inflation and to the downside for growth.
Chart 1.2
The war in the Middle East has disrupted energy supply, but the euro area entered the latest shock episode with some macroeconomic buffers
a) Strait of Hormuz transit calls | b) Euro area gas reserves | c) Euro area real GDP growth and headline inflation |
|---|---|---|
(22 Feb.-10 May 2026, number of ships) | (months of the year, percentages) | (Q1 2023-Q1 2026, percentages) |
 |  |  |
Sources: Bloomberg Finance L.P., UN Global Platform, IMF PortWatch, ECB and ECB calculations.
Notes: Panel c: the chart shows average annualised year-on-year GDP growth rates and average contributions from different components. Headline inflation is measured by the Harmonised Index of Consumer Prices.
Overall, the macroeconomic outlook is clouded by energy supply disruptions and uncertainty, even though near-term resilience remains partially intact. Structurally higher tariffs, high trade policy uncertainty and geopolitical tensions are now interacting with stress in energy markets and disruptions to shipping. The main concern surrounds the effect of a potentially enduring disruption in global energy markets if the war in the Middle East lasts longer than financial markets currently expect or if it escalates further. The extent of the impact will depend critically on the size and duration of the energy price shock. If sustained, it could weaken growth, tighten financing conditions and amplify cost pressures, bringing vulnerabilities across sovereigns, firms and households more sharply to the fore. Downside risks to growth and upside risks to inflation have therefore intensified materially since the outbreak of the war in the Middle East.
Box 1
Financial stability implications of geopolitical and geoeconomic risks
The outlook for global growth, inflation and financial stability has been adversely affected recently by unexpected geopolitical and geoeconomic events. Notably, the war in the Middle East has led to high levels of uncertainty and disruptions to the supply of oil and other energy commodities. This box evaluates recent developments in geopolitical and geoeconomic risks and assesses their impact on euro area financial stability.[6] To take into account the fact that these risks have multiple dimensions, the analysis reviews a wide range of up-to-date indicators relating to defence, trade and economic policy uncertainty, market volatility and migration (Chart A, panel a).[7] As a second step, it develops a new composite indicator of geoeconomic risk, integrating geopolitical, trade and financial market dimensions in a single metric, which can be used to analyse transmission to macro-financial risks (Chart A, panel b).[8]
More1.2 Public finances under pressure in a challenging geopolitical environment
Persistently high deficits and debt levels in some euro area countries remain key vulnerabilities. While many euro area countries have made progress on fiscal consolidation since the COVID-19 pandemic, some still have high deficits and debt levels. Governments face a long list of interrelated structural challenges, including the green and digital transitions, ageing populations, low productivity and, importantly, the urgent need to expand defence capabilities. Against this background, euro area government deficits are expected to remain sizeable or even to increase in 2026, driven in the case of Germany mainly by the implementation of the infrastructure and defence package (Chart 1.3, panel a). The positive impact of the Next Generation EU programme will fade going forward, given that it ends later this year, potentially without the full envelope of funds being disbursed.[9] With high deficits resulting in rising debt levels, governments have less room to respond to economic shocks, and doubts about future consolidation efforts could raise debt sustainability concerns among investors.
Chart 1.3
High deficits in some euro area countries, exacerbated by geopolitical tensions and defence spending, raise debt issuance needs
a) General government balance for 2025 and plans for 2026 | b) Net sovereign debt issuance, by country |
|---|---|
(percentages of GDP) | (Jan. 2018-Mar. 2026, € billions) |
 |  |
Sources: ECB and Eurostat (GFS), European Commission (draft budgetary plans) and ECB calculations.
Notes: Panel a: low debt means a debt-to-GDP ratio below 60%, medium debt a ratio between 60% and 100% and high debt a ratio above 100%. Spain is missing from the chart as it has not submitted a draft budgetary plan for 2026. Bulgaria is missing as it only joined the euro area at the beginning of 2026 and was not yet required to submit a draft budgetary plan. Panel b: net debt issuance is shown in 12-month trailing sums.
A challenging geopolitical environment, including the war in the Middle East, is posing significant headwinds to fiscal positions. Elevated geopolitical tensions, shifts in Europe’s security architecture and NATO’s new spending target have put defence expenditure at the centre of fiscal expansion. The Stability and Growth Pact’s national escape clause and the Security Action for Europe instrument were activated to help euro area countries meet necessary increases in defence spending. The war in the Middle East is presenting a significant additional challenge, especially via the resulting adverse energy price and supply shock. While the effect on euro area inflation and growth dynamics will clearly be adverse, the actual size of this effect is highly uncertain and will depend crucially on how long energy supply remains disrupted. However, several euro area countries appear to have limited capacity to create additional fiscal space to cushion the impact on households and firms, as they did during the energy crisis in 2022. Any support measures taken, such as reductions in taxes on fuel and other energy products, should be temporary, targeted and tailored.[10] If not, such measures could, in a worst-case scenario, risk destabilising fiscal positions.
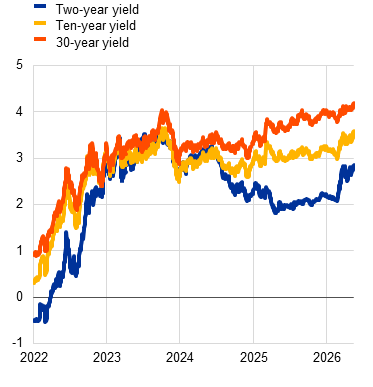
Higher debt issuance needs and tighter financing conditions are weighing on debt levels and interest burdens. Debt issuance needs are increasing to finance deficits, especially in countries where (defence-related) government spending is rising (Chart 1.3, panel b). Combined with both structural and cyclical factors, this is increasing rollover and interest rate risks over the short to medium term. On the structural side, Dutch pension fund reform, among other factors, has contributed to a shift in institutional investors’ demand for longer-dated debt, which has made the issuance of shorter-dated securities more attractive (see Chapter 2 and Box 2). On the cyclical side, rising uncertainty and upside risks to inflation since the outbreak of the war in the Middle East have led to an increase in euro area sovereign funding costs (Chart 1.4, panel a). Interest burdens are set to rise as a result, especially in countries with growing debt levels, further limiting the fiscal space available to tackle pressing issues (Chart 1.4, panel b). In addition, there is a risk of government financing becoming more sensitive to short-term changes in interest rates, including over the medium term when consolidation pressures are likely to arise.
Chart 1.4
Tighter financing conditions and rising interest burdens are amplifying fiscal vulnerabilities in euro area countries
a) Euro area sovereign bond yields | b) Year-on-year change in debt-to-GDP ratios and interest expenditures |
|---|---|
(3 Jan. 2022-19 May 2026, percentages) | (Q4 2024-Q4 2025, percentage points) |
 |  |
Sources: ECB and Eurostat (GFS) and ECB calculations.
Notes: Panel a: “Euro area sovereign bond yields” are the GDP-weighted averages of individual euro area countries’ yields. Panel b: low debt means a debt-to-GDP ratio below 60%, medium debt a ratio between 60% and 100% and high debt a ratio above 100%.
In an uncertain global environment, euro area public finances are vulnerable to shocks and changes in investor sentiment. The impact of the energy price shock is adding to existing fiscal challenges and may prove difficult for some countries to cushion. In addition, euro area sovereign financing conditions could be vulnerable to spillovers from global benchmark bond markets as changing risk perceptions lead to a repricing of global sovereign risk. Investor confidence may also be undermined if fiscal measures are perceived to be imprudent, future consolidation efforts are cast into doubt or political uncertainty surges again. A repricing of sovereign risk could also carry the risk of spillovers to the funding costs of corporates and banks. Governments should therefore ensure that their countries’ public finances are sustainable and comply with the EU’s economic governance framework. At the euro area level, it will be necessary to consolidate public finances in a way that supports growth over the coming years. Prioritising essential growth-enhancing structural reforms and strategic investment could make it easier to manage interrelated medium-term fiscal challenges. As an example, progress on the green transition could help to reduce critical dependencies on foreign energy sources.[11]
1.3 Renewed energy shock and tighter credit are testing corporate resilience
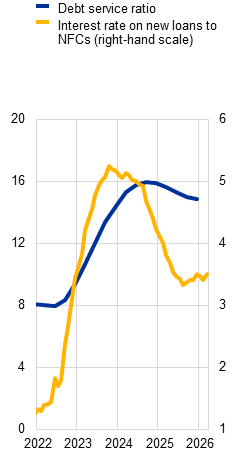
Corporate financing conditions have begun to tighten, as firms have continued to report weaker loan availability while banks have tightened credit standards. New lending to euro area non-financial corporations (NFCs) has weakened at the margin (Chart 1.5, panel a). In the latest survey data, firms reported unchanged needs for bank loans, while bank loan availability continued to weaken slightly, leaving the bank loan financing gap in positive territory in the first quarter of 2026.[12] Moreover, banks further tightened credit standards for loans to firms in the first quarter of 2026, the tightening being greater than expected and the most significant since the third quarter of 2023. Banks expect to see further marked tightening in the second quarter.[13] Against this backdrop, additional uncertainty and higher energy costs due to the war in the Middle East are likely to weigh further on firms’ credit demand and investment plans in the near term.
Higher borrowing costs continue to weigh on corporate debt servicing capacity. Lending rates on new loans remain above long-time averages, while firms’ debt service ratios are still high, even though interest payments have edged down at the margin (Chart 1.5, panel b).[14] Survey data indicate that interest expense has continued to rise, especially for small and medium-sized enterprises, while firms have also continued to report cost pressures from labour, materials and energy. At the same time, banks further tightened overall terms and conditions for new corporate loans in the first quarter of 2026, notably through higher lending rates, stricter collateral requirements and higher margins on riskier loans. Firms are thus entering this latest shock episode with less room to absorb further financial strain.
Signs of strain are becoming more visible in real-side indicators, as rising bankruptcies point to a tougher corporate environment. The continued increase in bankruptcies across sectors, together with weaker new passenger car registrations, is consistent with softer demand and renewed pressure on manufacturing (Chart 1.5, panel c). Banks have also tightened credit standards for loans to several sectors including construction, wholesale and retail trade, energy-intensive manufacturing and, most notably, the manufacturing of motor vehicles. Weakness in the car and manufacturing sector is likely related to trade tensions, but also to domestic structural factors as well as stronger Chinese competition in third markets. Also, the external environment has become even more challenging and is likely to weigh on confidence, profits and investment in the near term. However, rising insolvencies have not so far translated into either broad-based job losses (see Section 1.4) or a deterioration in bank asset quality (see Special Feature B).
Chart 1.5
Signs are emerging of a tougher corporate environment
a) New lending to NFCs | b) Debt service ratio and bank lending rates | c) Corporate bankruptcies and new car registrations |
|---|---|---|
(Jan. 2022-Mar. 2026, € billions) | (Jan. 2022-Mar. 2026, percentages) | (Q1 2022-Q4 2025; left-hand scale: index: Q4 2019 = 100, right-hand scale: percentages) |
 |  |  |
Sources: Eurostat, ECB (BSI, QSA, MIR), ACEA and ECB calculations.
Notes: Panel a: adjusted loans to euro area non-financial corporations (NFCs) reported by monetary financial institutions in the euro area (transactions). Negative values represent repayments. Panel b: the debt service ratio is the sum of the interest paid in the current and the past three quarters divided by the sum of net operating surplus and property income in the current and the past three quarters for the NFC sector. Bank interest rates are for loans to corporations (new business) in the euro area. Panel c: the grey area shows the minimum-maximum range of index values across all sectors. New passenger car and commercial vehicle registrations are for the euro area 20 (fixed composition, year-on-year growth).
The war in the Middle East is likely to affect firms unevenly, with energy- intensive and supply chain-exposed sectors being the most vulnerable. The impact of higher energy prices, through direct and indirect input linkages, extends well beyond electricity and energy products to sectors such as construction, metals and chemicals (Chart 1.6, panel a). At the same time, shipping costs and supply chain pressure indicators have turned upwards again, although they remain below their global financial crisis and pandemic-era peaks (Chart 1.6, panel b). In a fragmented geopolitical environment, import dependencies and supply bottlenecks can magnify macroeconomic and firm-level vulnerabilities. Low gas storage levels at the onset of the war in the Middle East are likely to result in costly and difficult replenishment, prolonging the energy cost shock and potentially reviving broader supply-side frictions.[15] Even firms with lower direct energy intensity could come under pressure if a prolonged shock were to weaken aggregate demand more broadly, as squeezed real income would likely curb discretionary household spending while elevated uncertainty could delay investment plans. Firms would therefore face an increasingly adverse combination of weaker demand, higher input costs and renewed logistical uncertainty.
Chart 1.6
Sectoral exposure to energy and supply chain shocks points to pockets of elevated corporate vulnerability
a) Implied energy share in euro area production across sectors | b) Global Supply Chain Pressure Index and Baltic Exchange Dry Index | c) Corporate vulnerability indicator |
|---|---|---|
(change in output per unit change in inputs) | (Jan. 2000-May 2026, indices) | (Q1 2019-Q2 2026E, z-scores) |
 |  |  |
Sources: Eurostat, Federal Reserve Bank of New York, Bloomberg Finance L.P., S&P Global Market Intelligence and ECB calculations.
Notes: Panel a: direct and indirect cost shares are calculated using the FIGARO symmetric input-output table for 2022. Results are broadly aggregated at NACE level 1 categories based on production weights. Panel b: the Global Supply Chain Pressure Index (GSCPI) integrates transport cost data and manufacturing indicators, while the Baltic Exchange Dry Index (BDI) is a composite of dry bulk time charter averages. Panel c: for details of the construction of the corporate vulnerability index, see Gardó et al.* Positive values indicate higher vulnerability while negative values indicate lower vulnerability.
*) Gardó, S., Klaus, B., Tujula, M. and Wendelborn, J., “Assessing corporate vulnerabilities in the euro area”, Financial Stability Review, ECB, November 2020.
Corporate balance sheets are not yet in a particularly fragile state, but underlying resilience is coming under increasing pressure. The composite corporate vulnerability indicator has edged down recently, moving below neutral levels (Chart 1.6, panel c). This is consistent with the broader balance sheet picture, as NFC gross operating surplus and entrepreneurial income strengthened further in the fourth quarter of 2025, while debt ratios declined as well.[16] At the same time, resilience buffers are becoming less comfortable: muted activity and weaker debt servicing capacity are exerting upward pressure on vulnerabilities, even as leverage and financing/rollover risks still act as offsets. Purchasing Managers’ Index readings were still pointing to expansion before the war in the Middle East and a part of investment may continue to be supported by digital and AI-related spending.[17]
Overall, while the corporate sector is not facing any immediate systemic stress, the risks are clearly tilted to the downside. Financing gaps have reopened, credit standards are tightening and bankruptcies are continuing to rise. Meanwhile, the external environment has become more challenging owing to tariffs, geopolitical risk and supply disruptions. NFCs entered the latest shock with balance sheets that were still resilient in aggregate but were already showing signs of gradual deterioration. Against this backdrop, a large and persistent disruption to energy supply, alongside renewed trade frictions and tighter financing conditions, could pose a significant test for corporates. The main implication is therefore not immediate distress but rather mounting downside risks that could increasingly weigh on corporate balance sheets if current shocks persist.
1.4 Labour market shelters household resilience, for now
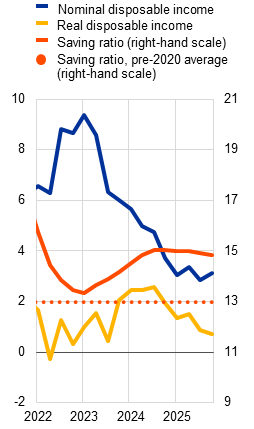
Euro area households remained cautious and maintained an elevated level of saving in 2025. Growth in real disposable income slowed, while the saving ratio remained above its pre-pandemic average as households drew on their income gains, partly to rebuild balance sheet buffers (Chart 1.7, panel a).[18] Recent survey evidence suggests that the high levels of saving among households are mainly down to concerns about future income risk (precautionary motive) and concerns about future taxes (Ricardian motive).[19] Against this backdrop, the loss of purchasing power linked to the war in the Middle East may lead households to draw down savings in order to smooth consumption in the short term. However, it is likely to weigh on private consumption over the medium term.
Before the war in the Middle East, private consumption was recovering gradually, from a subdued starting point. Both private consumption and investment contributed strongly to growth in late 2025. Nevertheless, households remained cautious, with real total consumption recovering only gradually and real non-durable consumption still below pre-pandemic levels (Chart 1.7, panel b). Consumer confidence recovered from its trough but fell sharply again in April, with expectations about the broader economy remaining the weakest component overall (Chart 1.7, panel c). A more persistent rise in energy prices could hamper the recovery by squeezing disposable income, particularly for low-income and low-wealth households. Meanwhile, trade and geopolitical tensions, alongside more general concerns about technological change and the impact of artificial intelligence, could add to fears about job security and affect overall household confidence.[20]
Chart 1.7
Household income growth moderates, but high levels of saving point to continued caution
a) Year-on-year growth in nominal and real disposable income and saving ratio | b) Real private consumption | c) Consumer confidence in the euro area |
|---|---|---|
(Q1 2022-Q4 2025, percentages) | (Q1 2022-Q4 2025, index: Q4 2019 = 100) | (Jan. 2022-May 2026, indices) |
 |  |  |
Sources: Eurostat, ECB (QSA, MNA), European Commission and ECB calculations.
Notes: Panel a: pre-2020 average saving ratio is calculated from the first quarter of 2000. Panel b: non-durable goods consumption is aggregated across those euro area countries for which there is a breakdown of consumption across different classes of goods and services. Non-durable goods consumption refers to the consumption of goods that can be used only once or that have a lifetime of considerably less than one year (including energy and food). Panel c: consumer confidence indicator (seasonally adjusted and demeaned). Euro area 20 (fixed composition) as of the 1 January 2023 European Commission (including Eurostat) Consumer Survey.
Labour market resilience continues, for now, to contain household vulnerabilities. Survey-based indicators of labour demand have edged down, particularly in manufacturing and construction (Chart 1.8, panel a). Hard data for the labour market are more reassuring, however, with unemployment still below and vacancy rates still above pre-pandemic averages (Chart 1.8, panel b). This helps to explain why the composite vulnerability indicator is still low overall and why the household sector does not currently appear to be a major source of financial stability risk (Chart 1.8, panel c). However, given the challenging external environment, a material deterioration in labour market conditions cannot be ruled out and would likely prolong consumption restraint and weaken household resilience.
Chart 1.8
Household vulnerabilities remain contained amid a still-favourable labour market
a) PMIs for employment in the euro area | b) Unemployment and job vacancy rates | c) Composite indicator of household vulnerabilities |
|---|---|---|
(Jan. 2022-Apr. 2026, indices) | (Q1 2005-Q1 2026, percentages) | (Q1 2005-Q2 2026E, z-scores) |
 |  |  |
Sources: S&P Global Market Intelligence, Eurostat, ECB and ECB calculations.
Notes: Panel a: a Purchasing Managers’ Index (PMI) value above (below) 50 implies an improvement (deterioration) in employment. Panel b: the pre-2020 average of the unemployment rate is calculated from Q1 2000, while the pre-2020 average of the job vacancy rate is calculated from Q1 2005. Panel c: the composite indicator is based on a broad set of indicators along five dimensions: (i) debt servicing capacity (measured by gross interest payments/income ratio, saving ratio and expectation of personal financial situation); (ii) leverage (gross debt/income and gross debt/total assets ratios); (iii) financing (bank lending rate, short-term debt/long-term debt ratio, quick ratio (defined as current financial assets/current liabilities) and credit impulse (defined as the change in new credit issued as a share of GDP)); (iv) income (real income growth and income/GDP ratio); and (v) activity (labour participation rate and unemployment expectations). Positive values indicate higher vulnerability while negative values indicate lower vulnerability.
1.5 Dynamics in property markets differ markedly across countries and segments
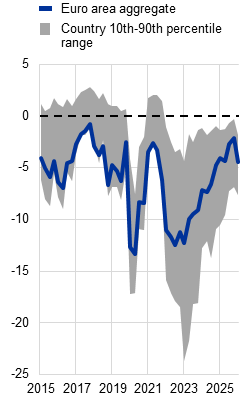
Residential real estate (RRE) prices saw a strong increase overall in the third quarter of 2025, albeit with significant cross-country variation. Euro area countries such as Bulgaria, Croatia, Lithuania and Portugal experienced solid growth in both RRE prices and mortgage lending (Chart 1.9, panel a), although household indebtedness remains relatively low in some cases. Conversely, countries such as Germany, France, Austria and Finland witnessed more subdued growth in both house prices and lending. At the same time, housing supply has failed to keep pace with rising demand in several countries. Indeed, the euro area Purchasing Managers’ Index (PMI) for residential construction remains below 50, which indicates subdued construction activity (Chart 1.9, panel b). This mismatch is contributing to housing shortages, thereby amplifying upward pressure on prices across multiple markets.[21] RRE prices are growing at a faster pace than income in some markets, causing an increase in overvaluation.[22] Consequently, rising measures of overvaluation, combined with tightening financial conditions, have resulted in a slight increase in tail risks for euro area RRE prices in early 2026 (Chart 1.9, panel c).
Chart 1.9
RRE markets in the euro area show contrasting developments in prices and lending growth, while housing supply remains subdued and downside risks increased mildly
a) RRE price growth and mortgage lending growth | b) Residential construction PMI | c) Estimated downside risk to RRE prices over the next year |
|---|---|---|
(Q4 2025, percentages) | (Jan. 2000-Apr. 2026, index) | (Q1 2015-Q1 2026, percentages) |
 |  |  |
Sources: ECB, S&P Global Market Intelligence and ECB calculations.
Notes: Panel a: the red dot represents the euro area (EA). Mortgage lending growth is adjusted for securitisation for all countries except Bulgaria. Data for Belgium refer to the second quarter of 2025 as RRE price data are not available for later dates. Panel b: a PMI value above (below) 50 implies an improvement (deterioration) in activity. Panel c: the chart shows the results obtained from an RRE price-at-risk model, based on a panel quantile regression on a sample including all euro area countries except Bulgaria and Croatia. The chart shows the fifth percentile of the predicted RRE price growth for the euro area aggregate and the 10-90th percentile range of this estimate across individual euro area countries. For further details, see Jarmulska, B. et al., “The analytical toolkit for the assessment of residential real estate vulnerabilities”, Macroprudential Bulletin, Issue 19, ECB, October 2022.
Commercial real estate (CRE) markets have stabilised during monetary easing, yet structural challenges remain. In recent quarters, the share of investors that consider the CRE market to be experiencing an upswing has remained broadly stable but subdued, at below 50% (Chart 1.10, panel a). At the same time, developments differ across countries: the majority of investors in markets such as Germany, France and Austria tend to view the market as being either near the bottom of the cycle or still in a downturn. Most investors in countries like Greece, Spain and Portugal, however, perceive market conditions as being either in an upswing or at the peak of the cycle. The share of investors who view CRE as expensive has also declined, suggesting that the CRE market is gradually being perceived as more attractive following the severe downturn seen in recent years. In line with these developments, CRE price indicators point to a return to positive annual growth. Sentiment, transaction activity and prices, while showing signs of stabilisation or modest improvement, remain at subdued levels overall compared with a few years ago. In particular, market activity remains weak across all sectors, with euro area transaction volumes still about 60% below their 2019 peak (Chart 1.10, panel b). At the same time, structural headwinds continue to weigh on parts of the market, contributing to a growing divergence between prime and non-prime segments. This is particularly evident in office markets, where the shift towards hybrid working practices continues to dampen demand and the outlook for lower-quality assets remains especially challenging.
Chart 1.10
Stabilisation in euro area CRE markets is ongoing, but market activity remains subdued, particularly in office markets, reflecting broader investor uncertainty
a) CRE market sentiment | b) CRE transaction volumes and prices |
|---|---|
(Q1 2016-Q4 2025, percentage of investors surveyed) | (Q1 2019-Q4 2025; left-hand scale: four-quarter rolling sum, |
 |  |
Sources: RICS, MSCI and ECB calculations.
The recovery in real estate markets continues to gain traction, but pockets of vulnerability call for risks to be closely monitored going forward. Real estate markets are highly sensitive both to developments in the broader real economy and to changes in medium to long-term interest rates and energy prices. This means that any escalation of geopolitical tensions which brings about a sharp deterioration in the economic outlook and/or a marked increase in interest rates is likely to weigh on demand for real estate. At the same time, a prolonged increase in energy prices might have a negative impact on supply. This might be particularly relevant in countries where housing valuations are stretched and in countries that have a large commercial office segment coupled with persistently high vacancy rates. Given the large size of banks’ RRE mortgage books, a significant rise in unemployment could pose financial stability risks where it results in a substantial increase in credit risk in this portfolio. By contrast, the size of banks’ exposures to CRE is more contained and unlikely to endanger the solvency of the euro area banking system. These exposures are not evenly spread across the banking system, however, and stress could arise among the euro area’s most exposed banks. Hence, it is important to continue to monitor risks stemming from property markets while preserving banking sector resilience (see Section 3.5).
2 Financial markets
2.1 Markets adjust to geopolitical conflict and energy shock
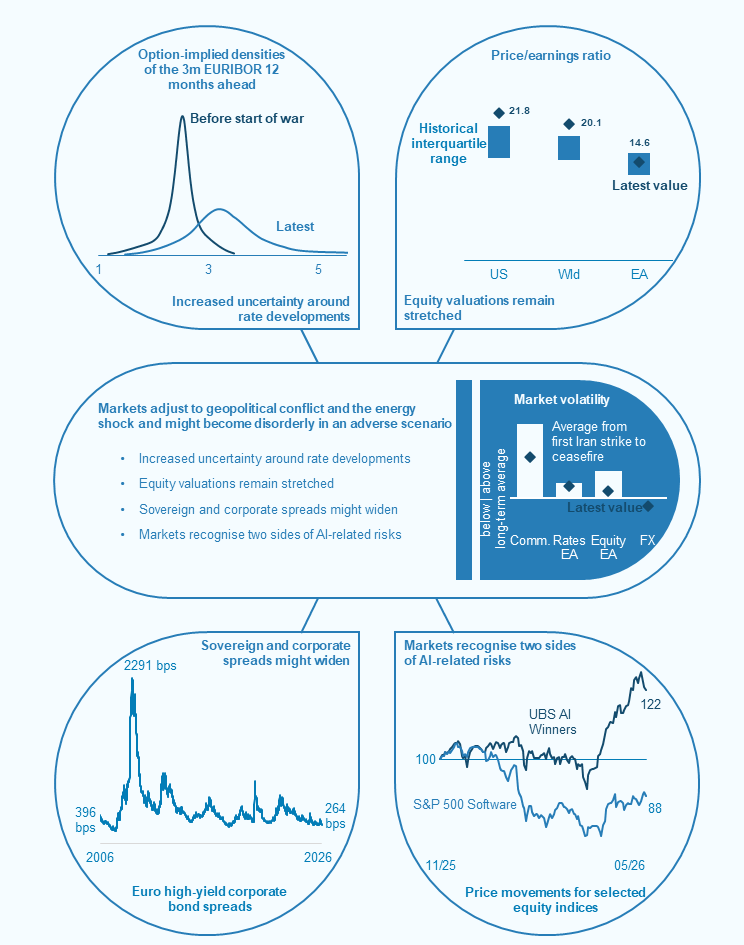
Geopolitical risks have materialised, and concerns about AI-related risks have re-emerged, challenging the prevailing benign market pricing. Market developments since the beginning of the year have been shaped by two forces – geopolitical events and uncertainty around the potential impact of artificial intelligence (AI). AI-related optimism may have partly offset the impact of geopolitical risks on market sentiment. At the same time, however, these forces may actually reinforce each other if the energy shock lasts longer than expected and challenges benign macro-financial expectations. Prior to the war in the Middle East, global markets were priced for a “Goldilocks” environment of resilient growth, moderating inflation and expectations of more accommodative monetary policies, supported by expectations of AI-driven productivity gains. This contributed to compressed risk premia, elevated valuations and increased risk taking. Until the outbreak of the war in the Middle East, market reactions to adverse geopolitical and AI-related shocks had remained relatively muted overall (Chart 2.1).
Chart 2.1
Market reaction to recent geopolitical and AI-related events had remained muted until the outbreak of the war in the Middle East
Reactions of selected asset classes to risk events since the November 2025 Financial Stability Review
(26 Nov. 2025-19 May 2026, z-scores)

Sources: Bloomberg Finance L.P. and ECB calculations.
Notes: “Start of Middle East war” refers to 2 March 2026, the first trading day after the start of the war on 28 February 2026; “Average of AI shocks” refers to the average of z-scores recorded on the days of the Anthropic announcement (17 February 2026) and of the publication of the Citrini report (22 February 2026); “Average of (geo)political shocks” refers to the average of z-scores recorded on the days of the US Supreme Court ruling on IEEPA (20 February 2026), of legal proceedings initiated against the Chairman of the Federal Reserve System and escalating tensions over Greenland’s sovereignty (9 January 2026) and of the US military intervention in Venezuela (3 January 2026). Z-scores are calculated by standardising the one-calendar-week change from the day before the shock, using the mean and standard deviation of rolling one-week changes over the preceding ten years. All changes are percentage changes except for two-year US Treasury, ten-year US Treasury, two-year Bund and ten-year Bund, which are simple differences. “Magnificent 7” comprises the stocks of Alphabet, Amazon, Apple, Meta, Microsoft, Nvidia and Tesla.
The war in the Middle East has disrupted global energy supply, triggering a repricing across asset classes. Oil and gas prices have risen sharply. Rising prices have also been observed in other commodities, including metals, fertilisers and helium, indicating broader cost pressures across sectors and supply chains, including those linked to AI-related infrastructure. The initial equity market reaction appears comparable to previous energy episodes, including in 2022, with euro area equity markets underperforming US markets (Chart 2.2, panel a), reflecting greater reliance on energy imports. Following the initial repricing, equity and corporate bond markets mostly rebounded on account of strong earnings reports in the United States, and market expectations for further positive news regarding geopolitical developments. Accordingly, valuations have partly moderated but remain stretched by historical standards for most markets (Chart 2.2, panel b).
Chart 2.2
The energy price shock has triggered strong but mostly short-lived equity market adjustments, and valuations remain stretched
a) Comparison of European subsector and index returns after the invasion of Ukraine and the start of the war in the Middle East | b) Equity and bond valuations |
|---|---|
(24 Feb.-13 May 2022, 27 Feb.-19 May 2026; percentages) | (1 Jan. 2005-19 May 2026, left graph: p/e ratios, right graph: basis points) |
 |  |
Sources: Bloomberg Finance L.P. and ECB calculations.
Notes: Panel a: 2022 and 2026 cover the ten trading days after the start of the Russian invasion of Ukraine and the outbreak of the war in the Middle East respectively. “Full period” covers the first 54 trading days, i.e. the number of trading days between the start of the war in the Middle East and the cut-off date for this edition of the Financial Stability Review. Panel b: for equities, the boxplot shows interquartile range of one-year forward price/earnings ratios relative to the distribution since 2005. The last edition of the ECB’s Financial Stability Review was published on 26 November 2025. For Wld, the MSCI World Index is used; for bonds, the boxplot shows interquartile range of latest z-spread compared with distribution since 2000. AU stands for Australia; EA stands for euro area; HK stands for Hong Kong; HY stands for high yield; IG stands for investment grade.
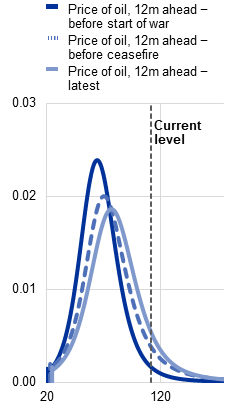
The energy price shock is raising concerns among market participants about higher inflation, lower growth and tightening financial conditions. Higher energy and commodity prices are contributing to renewed inflationary pressures and tighter financial conditions. Option-implied distributions point to elevated uncertainty around future oil prices and interest rates, with fat right tails indicating a greater probability of severe outcomes (Chart 2.3, panels a and b). Consequently, investors have revised their global monetary policy expectations towards a tighter stance, by pricing out the likelihood of rate cuts in the United States and pricing in rate hikes in most major markets (Chart 2.3, panel c).
Chart 2.3
Markets are pricing in elevated levels of uncertainty and the macroeconomic implications of the Middle East war, while reassessing global monetary policy paths
a) Option-implied probability density functions of oil prices | b) Option-implied probability density functions on three-month EURIBOR | c) Market expectation of policy rate cuts/hikes by major central banks |
|---|---|---|
(27 Feb.-19 May 2026, probability density function, USD per barrel) | (27 Feb.-19 May 2026, probability density function 12 months ahead, percentages) | (1 Jan.-19 May 2026, number of cuts/hikes expected by December 2026) |
 |  |  |
Sources: Bloomberg Finance L.P. and ESRB/ECB calculations.
Notes: Panels a and b: “before start of war” option strike is on 27 February 2026; “before ceasefire” option strike is on 7 April 2026; “latest” option strike is on 19 May 2026. Panel c: shaded area is after the start of the war in the Middle East on 28 February 2026.
Market functioning has remained orderly, but several bouts of volatility points towards a more fragile environment. Activity in energy derivatives markets has increased significantly, with margin calls met so far without any signs of disorderly deleveraging. However, recent developments point to increased sensitivity to volatility bouts following a prolonged period of low volatility (Chart 2.4, panel a). While the recent spike has been temporary and levels have moderated in most markets, elevated and rising volatility − particularly in commodity markets − could lead to larger margin calls, acting as an amplification channel in stress scenarios. A more persistent energy shock that affects the real economy more visibly could challenge stretched valuations in risky asset markets, push up volatility and trigger abrupt and potentially disorderly market adjustments. In parallel, repricing related to the evolving AI landscape could also contribute to increased uncertainty and thereby volatility, as the global economy and financial markets continue to adjust to AI-related structural changes. Shifts in expectations around productivity, profitability and sectoral dynamics would be reflected in asset prices across sectors and economies (see Section 2.3).
Cross-asset correlations could rise sharply in response to further geopolitical or inflation shocks, leading to simultaneous repricing across asset classes. Recent episodes suggest that traditional correlations could become less reliable, reducing the effectiveness of standard hedging strategies and increasing vulnerability to mark-to-market losses in stress episodes. After a short-lived initial increase, gold prices declined after the start of the war in the Middle East. Bonds could provide less effective diversification, increasing the likelihood of simultaneous losses and deleveraging across portfolios.[23] These dynamics could be reinforced by procyclical investment behaviour, particularly in an environment of persistently elevated valuations and compressed risk premia.
Chart 2.4
Volatility bouts and shifting safe-haven dynamics point to a more fragile market environment
a) Option-implied market volatility for a selection of asset classes | b) VIX and gold price, volatility and ETF flows |
|---|---|
(26 Nov. 2025-19 May 2026, z-scores) | (1 Jan. 2025-19 May 2026; index: 1 Jan. 2025 = 100, USD billions) |
 |  |
Sources: Bloomberg Finance L.P. and ECB calculations.
Notes: Panel a: z-scores show how high or low volatility is compared to ten-year averages. “Commodities” measured by CBOE volatility. EA stands for euro area; IG stands for investment grade; HY stands for high yield. The last edition of the ECB’s Financial Stability Review was published on 26 November 2025. “Start of Middle East war” refers to 28 February 2026 and “ceasefire” to 8 April 2026.
Safe-haven dynamics have been atypical in recent stress episodes, with no consistent pattern observed across assets. The price of gold has been volatile after reaching all-time highs at the beginning of the year. Its volatility has risen more than that of equities (Chart 2.4, panel b), reflecting rising real yields and deleveraging dynamics, as well as indications of recent central bank sales (including in some emerging market economies). Previous strong inflows into gold investment vehicles suggest increased retail participation, which may contribute to procyclical price dynamics and crowded positioning. While gold may offer protection against geopolitical uncertainty and sovereign risks over the medium term, its short-term performance is driven by market conditions. The emergence of tokenised gold instruments and the use of gold-backed assets in some stablecoin reserve structures point to financial innovation that may amplify price movements through procyclical flows and increased interconnectedness. The dynamics of other safe-haven assets have also been less stable.[24] Sovereign bond yields have increased (see Section 2.2) since the outbreak of the war in the Middle East, reflecting the inflationary nature of the conflict. At the same time, the US dollar has exhibited less consistent safe-haven characteristics through the different shocks over the last year, resulting in higher foreign exchange risk for euro area investors.
2.2 Bond markets start to be challenged by renewed macroeconomic uncertainties
Euro area sovereign bond markets face increasing pressure from rising yields, fiscal vulnerabilities and global spillovers. Across major advanced economies, sovereign yields have increased along the yield curve (Chart 2.5, panel a) since the previous edition of the Financial Stability Review was published. This in part reflects the rise in risk-free rates, driven by both higher term premia and expectations of higher rates amid renewed inflation concerns. Beyond the risk-free components, the rise in sovereign yields might also reflect concerns about fiscal vulnerabilities. In the United States, large fiscal deficits and sustained issuance have contributed to upward pressure on yields. Political uncertainty in May and resulting concerns about future fiscal sustainability have contributed to the rise in yields in the United Kingdom. In Japan, yields have risen significantly to reach levels comparable with other advanced economies. This could prompt global portfolio reallocation into Japan, reduce Japanese demand for foreign bonds and contribute to upward yield pressure globally, including in the euro area. In addition, geopolitical developments may lead to shifts in global capital flows, including changes in the recycling of oil revenues, which could further influence sovereign bond price dynamics. Euro area sovereign bond markets have continued to function smoothly, with spreads contained so far (see Overview, Chart 2, panel c). That said, some signs of liquidity deterioration emerged around the start of the war in the Middle East, although they were short-lived (Chart 2.5, panel b). Higher yields are, however, pushing up debt service costs, while a shift towards issuance with shorter maturities could raise rollover risks. A prolonged energy shock and its adverse impact on inflation, growth and fiscal positions could continue to weigh on sovereign bond markets.
Chart 2.5
Rising yields and high issuance needs increase rollover and spillover risks in sovereign markets
a) 2-, 10- and 30-year sovereign yields in selected advanced economies | b) Liquidity indicator for euro area government bonds |
|---|---|
(26 Nov. 2025, 19 May 2026; percentages) | (1 July 2025-19 May 2026, index) |
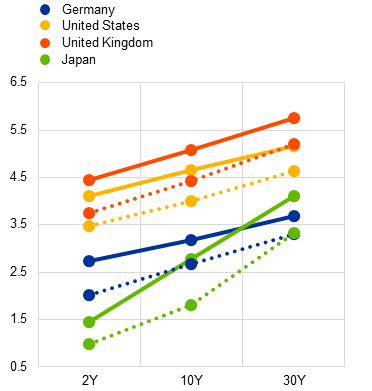 |  |
Sources: Bloomberg Finance L.P., Euro MTS Ltd, S&P Dow Jones Indices LLC and/or its affiliates, MarketAxess and ECB calculations.
Notes: Panel a: solid line indicates the latest observation; dashed line indicates the 26 November 2025 publication date of the last edition of the ECB’s Financial Stability Review. Panel b: market liquidity indicators are based on the methodology set out in “Systemic liquidity risk: a monitoring framework”, ESRB, February 2025. Indicators are smoothed by a five-day moving average to adjust for seasonal patterns in weekdays. The composite indicator is based on bid-ask spread, bid-ask spread dispersion, market efficiency coefficient, share of non-quoted or non-traded securities, transaction spread, traded volume, turnover ratio and average number of market-makers. Some indicators are available with a time lag and are hence not included in the most recent data points.
Structural fiscal vulnerabilities and shifts in the investor base may amplify the risks of abrupt repricing in sovereign bond markets, with potential spillovers to corporate bond markets. Changes in the investor base are shaping dynamics in sovereign markets (see Box 2), with global hedge funds increasing their presence in euro area sovereign bond markets. While supporting liquidity, their more price-sensitive and, in some cases, leveraged strategies may make market pricing more sensitive to changes in sentiment. At the same time, high sovereign financing needs related, among other things, to defence spending, the green transition and potential fiscal measures to cushion households and firms from rising energy prices, are likely to add to pressures over the medium term (see Chapter 1). A scenario of notably weaker growth associated with a more persistent energy shock could trigger a reassessment of fiscal sustainability and an abrupt repricing in sovereign bond markets. Such developments could spill over to corporate financing conditions, reinforcing adverse feedback loops between sovereigns, financial markets and the real economy and posing risks to euro area financial stability.
Spreads on riskier euro area corporate bonds remain compressed, despite heightened geopolitical tensions and strong issuance. In contrast to a slowdown in bank lending to corporates (see Section 1.3), issuance of euro area corporate bonds was on track to reach its highest level since the COVID-19 pandemic, until the outbreak of the war in the Middle East (Chart 2.6, panel a). This likely reflected benign refinancing conditions, as corporates could refinance at yields that were similar to yields on bonds they had already issued. Issuance stalled among riskier corporates, as uncertainty rose in March, but picked up again after the ceasefire agreement. Neither the strong issuance nor the increase in geopolitical tensions has led to any significant widening of spreads, which have remained at around their long-term lows for euro area corporates with weaker ratings (Chart 2.6, panel b). In addition to market expectations on contained effects of the energy supply shock on risky euro area corporates, there are three possible factors behind this. First, corporate balance sheets are reportedly solid, while worries about fiscal debt sustainability have increased (see Chapter 1), which might have led to a convergence of credit risk in corporate and sovereign bond markets. Second, the riskiest issuers may have turned to private credit funding and reduced their issuance of corporate bonds. Third, attractive yields may have bolstered demand and caused investors to be less attentive to whether the spread component was adequately rewarding them for the risks taken.
Chart 2.6
Despite strong issuance and an increase in geopolitical tensions, spreads in euro area corporate bond markets remain compressed
a) Issuance volumes and rollover costs for euro area investment-grade and high-yield corporate bonds | b) Euro area high-yield corporate bond spreads and yields |
|---|---|
(1 Jan. 2019-19 May 2026; € billions, percentage points) | (1 Jan. 2006-19 May 2026; basis points, percentages) |
 |  |
Sources: Dealogic, a service of ION Analytics, Bloomberg Finance L.P., ICE and ECB calculations.
Notes: Panel a: face value-weighted average difference between yield to worst and coupon rate of individual bonds in the ICE BofA Euro Corporate Index and ICE BofA Euro High Yield Index. Average of daily data per month. 28 February: start of the war in the Middle East; 8 April: first day of the ceasefire. Panel b: government option-adjusted spread and yield to maturity of the ICE BofA Euro High Yield Index depicted. “Latest spread” is on 19 May 2026.
Risks from private credit markets could spill over to other debt markets with a similar risk profile. Private credit now accounts for a significant share of newly extended credit to riskier euro area corporates (Chart 2.7, panel a). Starting last autumn, concerns have arisen around the quality of private credit. Such concerns could intensify, should geopolitical tensions erode growth or worsen financing conditions. Survey results point towards investors assessing private credit as the most likely source of a credit event.[25] Although private credit markets remain small in the euro area, they are characterised by significant cross-border flows and a high level of opaqueness (see Special Feature D). Stress in the private credit space could spill over to public bond and leveraged loan markets if private credit were to dry up and companies needed to revert to public bond markets.[26] Spreads that previously compressed simultaneously across private credit, leveraged loan and high-yield bond markets (Chart 2.7, panel b) might then rise in tandem.
Chart 2.7
Risk from private credit markets might spill over to other risky debt markets
a) Issuance of private credit, leveraged loans and high-yield corporate bonds by euro area borrowers | b) Spreads of euro area private credit, leveraged loans and high-yield bonds over EURIBOR |
|---|---|
(2006-26, € billions) | (Jan. 2020-May 2026, basis points) |
 |  |
Sources: PitchBook, a Morningstar company, Bloomberg Finance L.P. and ECB calculations.
Notes: Panel a: debt amount is used as the measure of issuance for private credit loans. As loan volume data are missing for a subset of transactions, the private credit series likely understates total issuance and should be interpreted as a lower bound. Amendments and repricings are excluded from the leveraged loan and high-yield bond series to isolate new financing activity. This distinction cannot be implemented for private credit data; however, given the opacity and bespoke structure of such transactions, amendments and repricings are expected to represent a relatively small share of overall private credit volumes. Latest available data are as of 19 May 2026 for private credit and 15 May 2026 for leveraged loans and high-yield bonds. Panel b: “Spreads” refers to euro area firms. Private credit and leveraged loans are priced over EURIBOR. High-yield bond spreads are measured using the ICE BofA Euro High Yield Corporate OAS. Series are shown as three-month rolling averages. Private credit spreads are trimmed at the 5th and 95th percentiles within the month. The latest available data are shown as of 19 May 2026. Due to insufficient observations, private credit spreads are shown only until February 2026. The cited data on both panels has not been reviewed by PitchBook analysts and may be inconsistent with PitchBook methodology.
Box 2
Along the curve: investor reallocation in euro area government bonds
After a period of relative flatness, the yield curve for euro area government bonds (EGBs) steepened markedly in 2025, driven mainly by rising yields at the long end. This trend has persisted amid continued upward pressure on yields, particularly for maturities beyond ten years. It reflects several factors, including fiscal expansion in response to geopolitical uncertainty, reduced demand from central banks and structural shifts such as the recent Dutch pension fund reform.[27] This box sheds light on the role that euro area investor composition plays in EGB markets in a context of steepening yield curves.
More2.3 Concentrated exposures could increase the risk of abrupt cross-asset repricing
Prior to the resurgence of geopolitical risk (see Section 2.1), markets were mainly driven by a growing differentiation in AI-related exposures. It appears that, since the start of the year, investors have increasingly recognised that there are two sides to AI-related risk. On the one hand, there are long-standing concerns that AI could disappoint the lofty expectations associated with its ability to boost productivity and generate high earnings for “hyperscalers” − companies that operate large-scale cloud infrastructure and are expected to benefit from growing AI demand. This would be despite the good track records such companies have in meeting their earnings expectations. The result has been falling valuations across an index of “AI winners”, although they have more than recovered since the end of March, driven by a general turn in risk sentiment and strong earnings reports (Chart 2.8, panel a). On the other hand, worries have emerged that AI could exceed expectations. This could, in an extreme case, lead to a significant rise in unemployment or, in a more likely scenario, disrupt existing business models and structures in sectors like software. These worries are reflected in the sharply falling prices of software-related stocks.
Chart 2.8
Two-sided risks to the AI narrative moved markets before the outbreak of the war in the Middle East
a) Price movements for selected equity indices | b) Global equity sector weights as a share of market capitalisation |
|---|---|
(26 Nov. 2025-19 May 2026, index: 26 Nov. 2025 = 100) | (19 May 2026, percentages) |
 |  |
Sources: Bloomberg Finance L.P. and ECB calculations.
Notes: Panel a: detailed information on the UBS AI Winner Index (UBSXAIW Index) can be found in the associated Index Guideline. Indices are indexed to the 26 November 2025, publication date for the last edition of the ECB’s Financial Stability Review.
Euro area equity markets appear less exposed to sectors at risk of being replaced by AI, but they could be vulnerable to changes in global risk sentiment. Broad euro area equity markets have been less affected by concerns around the software sector and AI investments than their US peers due to smaller IT exposures (Chart 2.8, panel b). Therefore, euro area equities outperformed their US peers for a short time. However, euro area equities started to underperform US markets after the war in the Middle East broke out, on account of the euro area’s higher reliance on imported energy (see Section 2.1). Going forward, global equity markets may be driven by their dominant sectors’ vulnerability to replacement by AI. Sectors that rely less on physical assets and more on intangible assets (such as IT and financials) could be particularly exposed, while sectors that are characterised more by significant investments in tangible, long-lived assets (such as industrials and utilities) could be better shielded. In addition, global markets are likely to be affected by changes in risk sentiment due to AI earnings prospects or disappointments, even in unrelated sectors or regions.
Debt markets are also signalling concerns about the IT sector, and the increased reliance of AI-related companies and infrastructure on debt financing warrants attention. In addition to equity markets, debt markets are now also showing signs of AI-related concerns, as the bond spreads of riskier IT companies have widened significantly more than broad bond spreads (Chart 2.9, panel a). While a large part of the AI-induced spending boom has been financed from profits, AI-related companies and infrastructure have started to rely increasingly on credit financing. This could become an issue from a financial stability perspective. Strong growth in either equity prices or business debt in isolation has not been associated with financial crises in the past. That said, 15% of those years that showed particularly strong growth in both equity prices and business debt have been followed by a financial crisis within two years (Chart 2.9, panel b). Equity price growth in the United States has been very rapid of late, but business debt growth currently stands at low levels for both the United States and the euro area. Nonetheless, it will be important to closely monitor whether the increasing credit financing of AI-related companies and infrastructure translates into a significant upswing in business debt.
Chart 2.9
Greater debt financing for AI is concerning for financial stability, as strong growth in both equity valuations and business debt preceded past crises
a) Euro area and US corporate bond spreads | b) Crisis frequency, by price and debt growth quantiles |
|---|---|
(1 Mar. 2025-19 May 2026, basis points) | (percentages) |
 |  |
Sources: Jordà, Schularick and Taylor*, IMF, Bloomberg Finance L.P. and ECB calculations.
Notes: Panel a: corporate bond spreads calculated over the OIS swap curve and weighted by market value. EA stands for euro area; HY stands for high yield. Panel b: based on Greenwood et al.** Three-year change in business debt-to-GDP, three-year equity price growth, start of a crisis within the next two years. Current positions are calculated using 2024 debt-to-GDP figure and 2025 equity price. “Euro area average” consists of average of Belgium, Germany, Spain, France, Italy, Netherlands, Portugal and Finland. Probabilities are calculated using data terciles and quintiles with financial crisis indicators over total period.
*) Jordà, Ò., Schularick, M. and Taylor, A.M., “Macrofinancial History and the New Business Cycle Facts”, in Eichenbaum, M. and Parker, J.A., NBER Macroeconomics Annual 2016, Vol. 31, National Bureau of Economic Research, 2017.
**) Greenwood, R., Hanson, S.G., Shleifer, A. and Sørensen, J.A., “Predictable Financial Crises”, The Journal of Finance, Vol. 77, Issue 2, 2022, pp. 863-921.
Private markets are exposed to both sides of AI-related risk. The share of deals that involve software firms with venture capital and private equity has increased sharply and is also significant for private credit (Chart 2.10, panel a). At the same time, venture capital and private credit are also particularly important sources of funding for AI-related investments (Chart 2.10, panel b). With their traditionally longer investment horizons and higher risk-bearing capacities, private markets appear well suited to financing these more innovative, higher-risk companies. Nonetheless, risks might be especially significant for private credit investors. This is because losses incurred by such investors due to the failure of AI or software firms are not counterbalanced by participation in the success of other companies in their portfolio, as is the case for private equity and venture capital.
Chart 2.10
Private markets are highly exposed to both sides of AI-related risk
a) Share of software firms in global private market deals | b) Share of AI funding in global private market deals |
|---|---|
(2010-26, percentages) | (2010-26, percentages) |
 | 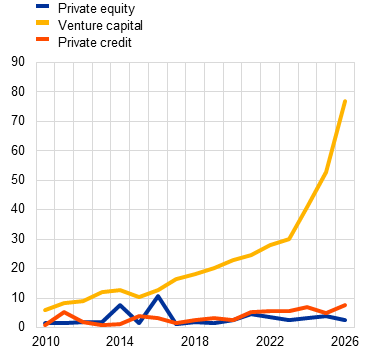 |
Sources: PitchBook, a Morningstar company, and ECB calculations.
Notes: Panel a: global private market transactions divided by primary industry sector and primary industry group. Panel b: AI funding share refers to deals involving firms operating in the PitchBook-defined verticals “Artificial intelligence and machine learning”, “Big Data” and “Cloudtech and DevOps”. Deals in both panels are not mutually exclusive, as a software firm might operate in these verticals. This is particularly relevant for venture capital deals. The cited data in both panels has not been reviewed by PitchBook analysts and may be inconsistent with PitchBook methodology. Both panels show the latest available data as of 19 May 2026.
Concentrated exposures to both sides of AI-related risk across markets set the stage for abrupt cross-asset repricing should sentiment shift further. Increased differentiation in AI-related exposures aids price discovery and, provided it happens gradually, might be beneficial in terms of financial stability. There are, however, concentrated exposures to AI-related investments and to sectors whose business models could be challenged by AI across public and private equity and debt markets. This leaves room for non-linear correlated losses for investors in various scenarios, especially in an environment of rising volatility and increasing sensitivity to tail risks (see Section 2.1). The currently high earnings growth of the largest AI-related companies might also be supported by growing interrelated business activities, which could amplify spillover effects if risks were to materialise. In addition, the current energy shock could interact with AI-related risk, as rising energy demand from AI-related infrastructure and data centres may further amplify cost pressures and investment needs in the AI sector.
3 Euro area banking sector

3.1 Aggregate bank profitability remains strong in a changing operating environment
Headline bank profitability remains strong, but revenue growth has decelerated. Banks’ return on equity was hovering close to 10% in 2025. This came about despite a further decline in net interest income, which was offset by growth in non-interest income and an improved contribution from operating expenses (Chart 3.1, panel a). Non-interest income has been the largest driver of revenue growth since the ECB first started cutting rates again in June 2024, although its contribution has diminished recently. Since the end of 2025, growth in non-interest income has come mainly from less conventional sources of income. By contrast, both net fee and commission income and net trading income, which together account for the bulk of banks’ non-interest income, have remained at similar levels (Chart 3.1, panel b).[28] Going forward, the strength of banks’ profitability remains uncertain, as revenue growth has relied heavily on historically volatile income streams. At the same time, rising IT and cybersecurity investment needs may add upward pressure on costs, amid heightened geopolitical uncertainty (see Box 1).
Chart 3.1
Euro area banks’ profitability has increased slightly, supported by non-interest income
a) Return on equity and decomposition of year-on-year change in net income | b) Year-on-year growth and decomposition of non-interest income |
|---|---|
(Q1 2022-Q4 2025; percentages, four-quarter percentage point changes) | (Q1 2024-Q4 2025; € billions, four-quarter percentage changes) |
 |  |
Sources: ECB (supervisory data) and ECB calculations.
Notes: Based on a full sample of euro area significant institutions. Income items are defined as the four-quarter trailing sum of flows divided by the book value of equity in a given quarter. Panel a: return on equity calculated as the four-quarter trailing sum of income items divided by the book value of equity in a given quarter. Panel b: “Other profit and loss items” are the residual, defined as the difference between net income and net interest income, non-interest income, loan loss provisions and operating expenses.
Bank profitability varies significantly across countries, due to persistent differences in net interest income. Since 2022 pronounced differences in bank profitability have emerged across euro area countries (Chart 3.2, panel a). Most of the dispersion is still driven by net interest income differentials that can be traced back to variations in structural factors, including interest rate fixation practices and competition within individual countries (Chart 3.5, panel c). That said, the gradual convergence of banks’ net interest income has reduced the income gap between low and high earners. However, other factors have increased the differences, as it has been mainly banks with high returns that have experienced a decline in operating expenses relative to total assets (Chart 3.2, panel b). Moreover, the recent rise in benchmark rates could lead to a renewed widening of the net interest income gap, reinforcing the differences between high and low earners.
Chart 3.2
Differences in profitability persist across countries and banks
a) Average ROA of euro area banks, by country | b) Differences in cost and income items between banks with high and low ROA |
|---|---|
(Q1 2022-Q4 2025, percentages of total assets) | (Q1 2022-Q4 2025, percentages of total assets) |
 |  |
Sources: ECB (supervisory data) and ECB calculations.
Notes: Based on a full sample of euro area significant institutions. ROA stands for return on assets. It is calculated as the four-quarter trailing sum of net income divided by the book value of total assets in a given quarter. Panel a: only the eight largest countries in terms of total assets with a minimum of three banks are shown. Floating-rate countries are those with a share of floating-rate corporate lending above 50%. EA stands for euro area. Panel b: the sample of above- and below-median ROA is fixed in Q4 2025 to prevent banks moving between categories. Contributions from net trading income, other operating income and other profit and loss items are not included in the comparison.
Net interest income has continued to decline, but the recent change in market rates could support an improving outlook. As a further erosion of margins outweighed modest volume growth, net interest income declined slightly in 2025 (Chart 3.3, panel a). These aggregate developments conceal two diverging trends: floating loan rates have declined steadily since the first ECB rate cut in 2024, while fixed loan rates have continued to rise (Chart 3.3, panel b). However, there are incipient signs that net interest income may have passed its trough, as net interest margins increased slightly during the last quarter of 2025, and the dynamics could change even more significantly in the light of developments in the Middle East. As market participants have started to price in rising benchmark rates in the course of 2026, bank analysts have lifted their forecasts for net interest income. While higher interest rates tend to increase net interest income,[29] the outlook is made more uncertain by the ongoing bear flattening of the yield curve, substantially lower loan demand and tighter credit standards (Chart 3.3, panel c).
Chart 3.3
The outlook for net interest income turns more uncertain with current developments
a) Decomposition of change in net interest income and level of net interest margin | b) Rates on outstanding loans, by fixation type, and €STR and forward rate | c) Loan demand and credit standards |
|---|---|---|
(Jan. 2022-Dec. 2027E, percentages) | (Q1 2026, percentages of banks, right scale inverted) | |
 | 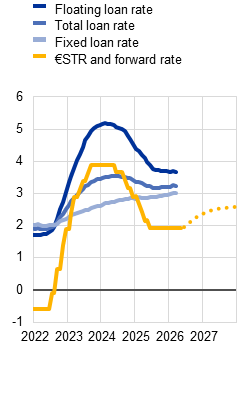 | 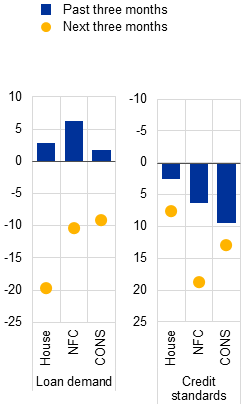 |
Sources: ECB (supervisory data, BSI, BLS, MIR), Bloomberg Finance L.P. and ECB calculations.
Notes: Panel a: based on a full sample of euro area significant institutions. Panel b: based on a full sample of euro area monetary financial institutions. Lending rates are the weighted average outstanding rate on all retail lending, including non-financial corporate, house purchase and consumption loans. Panel c: numbers refer to the percentage of banks indicating a net increase in loan demand (left graph) and a net tightening in credit standards (right graph). The scale on the right graph is inverted, as positive numbers indicate a tightening. “House” stands for household for house purchase; NFC stands for non-financial corporations; CONS stands for consumer credit.
While recent events have affected the stock market valuations of euro area banks, profitability projections have remained strong. Analysts anticipate improved returns on equity for 2026 and 2027 on higher operating income (Chart 3.4, panel a). The war in the Middle East has further strengthened these expectations, given the impact of higher interest rates and financial market volatility on net interest income and trading and fee income. Expectations of improved profitability and payouts contributed to the continuing outperformance of euro area bank stocks until early 2026. However, concerns about private credit exposures and the potentially disruptive impact of artificial intelligence on business models triggered a decline in bank stock valuations on both sides of the Atlantic from February, especially for global systemically important banks.[30] The decline further intensified following the outbreak of the war in the Middle East and valuations have remained volatile following the ceasefire agreement (Chart 3.4, panel b).
Looking ahead, profitability projections and share prices will continue to be subject to downside risks. Geopolitical uncertainties may affect economic growth in a way not yet accounted for in forecasts, and heightened financial market volatility bears risks as well as opportunities for non-interest income. As the banking sector is one of the most cyclical given its leverage, its profitability and stock market valuations remain sensitive to overall market dynamics and, in particular, the macroeconomic outlook (see Box 3).
Chart 3.4
Volatile environment shapes operating profit expectations and valuations
a) Drivers of expected return on equity | b) Changes in European bank and stock market indices |
|---|---|
(2026E, 2027E, 2028E; percentages of equity) | (26 Nov. 2025-19 May 2026; indices: 26 Nov. 2025 = 100) |
 |  |
Sources: LSEG, Bloomberg Finance L.P. and ECB calculations.
Notes: Panel a: based on a sub-sample of 25 banks from the EURO STOXX Banks index, using mean as consensus. The cut-off date is 19 May 2026. “Op. inc.” stands for operating income; “Opex” stands for operating expenses; LLP stands for loan loss provisions; P&L stands for profit and loss. Panel b: the indices used are EURO STOXX Banks for banks and EURO STOXX for markets. Cumulative percentage changes with 26 November 2025, the publication date for the last edition of the ECB’s Financial Stability Review, set at 100. The cut-off bars refer to 2 February, 27 February and 7 April 2026 for the last trading days before the start of the artificial intelligence/private credit concerns, the war in the Middle East and the ceasefire announcement respectively.
Box 3
The drivers of the 2025 surge in euro area banks’ market valuations
The market valuations of euro area banks rose sharply between the start of 2025 and early 2026 to reach levels last seen before the global financial crisis. Following more than a decade of persistently depressed valuations and low profitability,[31] euro area banks’ price-to-book (P/B) ratios have been on an upward curve since late 2022, with the most significant increase seen during 2025. Euro area banks have converged with their US peers in terms of profitability, and consequently the gap between euro area and US bank valuations has narrowed significantly (Chart A, panel a). By February 2026, the euro area aggregate P/B ratio had reached a level not seen since before the global financial crisis, although it then receded, mainly due to the outbreak of war in the Middle East. In the period up to February 2026, increased shareholder payouts and an expectation that high payouts would continue for the next couple of years, along with a rising proportion of share buybacks, may have also helped to make euro area bank shares more attractive for investors (Chart A, panel b).
More3.2 Bank funding conditions stay benign, but could tighten
Deposit rates have remained stable but could see upward pressure from higher benchmark rates and increased competition amid scarcer liquidity. Rates paid on overnight deposits, which constitute a large share of bank funding, have been virtually unchanged since August 2025, reflecting stable policy rates. There has been a marginal increase in new business rates on deposits with agreed maturity, in line with rising interbank rates. While the increase in benchmark rates remained modest until the end of February, it has picked up notably since then and could trigger renewed upward pressure on term deposit rates (Chart 3.5, panel a). Across countries, deposit rates tend to be higher in less concentrated euro area banking sectors, indicating greater competition (Chart 3.5, panel b). As higher deposit rates and fiercer competition also appear to coincide with tighter lending spreads, net interest income is squeezed from both the funding and the lending side (Chart 3.5, panel c). Given the high fragmentation of deposit and loan markets within the euro area,[32] differences are likely to persist. Competition for deposits could intensify, however, if liquidity became scarcer, wholesale funding conditions worsened or more aggressive players entered the market.[33] Taking this together with the rising benchmark rates, banks might see some tightening of deposit funding conditions.
Chart 3.5
Deposit rates are broadly stable but very uneven across euro area countries
a) Deposit rates on new business, deposit facility rate and 12-month EURIBOR | b) Average deposit rate on new business vs market concentration | c) Net interest margins and deposit spread contribution |
|---|---|---|
(Jan. 2024-19 May 2026, percentages) | (Mar. 2026; HHI, percentages) | (Q1-Q4 2025, percentages of total assets) |
 |  |  |
Sources: ECB (MIR, BSI, supervisory data), LSEG and ECB calculations.
Notes: Panel a: rates on new business until March 2026. NFC stands for non-financial corporation; HH stands for household. Panel b: Herfindal-Hirschmann Index (HHI) on total outstanding deposits in the euro area, consolidated at the bank-country level and calculated as the sum of the squared shares of banks within a market relative to the total deposit market. The new business deposit rate is the total deposit rate by country, including household and NFC deposits at all maturities. Panel c: net interest margins are net interest income divided by total assets. “Deposit spread contribution” is the difference between the hypothetical income earned from placing deposit funds in the overnight money market and receiving the euro short-term rate (€STR) and the actual expense paid on deposits. Reporting countries with less than three banks are excluded due to data confidentiality requirements. Data are consolidated across all exposure regions (including non-euro area) at the bank level.
Bank funding has gradually been shifting back towards a higher share of overnight deposits, supporting profitability at the margin. After contracting during the cycle of interest rate hikes, overnight deposits started to grow again following the first ECB rate cut in June 2024 (Chart 3.6, panel a). Although the total share of retail deposits in banks’ funding has changed little,[34] the term structure of deposits is important, given the substantial negative spread over policy rates and the rate insensitivity of overnight deposit rates compared with other funding sources.[35] As overnight deposit rates are also less sensitive to interest rate changes than variable lending rates, an increasing share of overnight deposits in a bank’s funding mix tends to support net interest income. [36]
Chart 3.6
Household overnight deposits and repos have gained importance in bank funding
a) Composition of euro area banks’ liabilities and cumulative changes since Q4 2023 | b) Distribution of euro area banks’ average net position in repo markets, by decile |
|---|---|
(Q1 2015-Q4 2025; percentage shares of total non-equity non-derivative liabilities; 2024-25, change in percentage share) | (Q1 2026, percentages of total assets) |
 |  |
Sources: ECB (supervisory data, MMSR) and ECB calculations.
Notes: Panel a: “Other funding” includes household term and deposits redeemable at notice, NFC deposits, unsecured funding from financials, and central bank, government and bond funding. Panel b: “Net position” is the sum of the average daily bank-level repo lending less repo borrowing in Q1 2026, for banks within a given decile of the net-borrowing distribution.
Repo liabilities have also increased, although this is partly linked to money market intermediation. The share of repos in banks’ total liabilities has grown over the past two years. After accounting for banks’ reverse repo lending activities, however, banks’ average net funding position shrinks to about a quarter of its prior size. Although banks are net borrowers in the repo market, much of their repo activity reflects daily money market intermediation rather than funding needs (Chart 3.6, panel b). Nonetheless, a few banks with larger funding positions may be vulnerable to repo market gyrations.[37] The expansion of banks’ repo intermediation is likely to continue alongside the decline in excess liquidity, and banks may also rely more on the repo market for funding in net terms.
Euro area bank bond yields have increased markedly since the outbreak of the war in the Middle East, but spreads have narrowed. The financing conditions for bank bonds have tightened significantly, as yields have risen by around half a percentage point since the end of February. This increase has been driven by higher benchmark rates, whereas bank bond spreads have tightened (Chart 3.7, panel a). Bank bond issuance on primary markets halted briefly at the start of the war but resumed shortly thereafter. Banks will face higher funding costs for new issuances over the coming months, should benchmark rates remain elevated. By contrast, credit spreads across different ratings are softening the impact as the level and dispersion of spreads has narrowed substantially over the past two years (Chart 3.7, panel b). This suggests that investors currently perceive bank credit risk as low, likely supported by banks’ robust capital ratios, profitability and asset quality, but also by the benign market sentiment overall.
Chart 3.7
Bank bond financing conditions remain favourable despite an increase in yields
a) Secondary market bank bond yields and changes since the start of the Middle East war | b) Distribution of secondary market bank bond asset swap spreads, by rating |
|---|---|
(1 Jan. 2024-19 May 2026; percentages, basis points change since 27 Feb. 2026) | (1 Jan. 2024-19 May 2026, density) |
 |  |
Sources: S&P Dow Jones Indices LLC and/or its affiliates and ECB calculations.
Notes: Panel a: bond spreads are asset swap spreads over market benchmark rates. Panel b: spreads are averaged for each bond over a given month, and bonds are allocated to spread buckets with a width of 50 to 100 basis points. Density is the total amount outstanding of all bonds within a spread bucket as a share of total amount outstanding for the rating class. Bank bonds include unsecured and covered bonds and exclude AT1.
3.3 Asset quality continues to be high amid pockets of vulnerability
Aggregate bank asset quality remains stable at a high level. The aggregate non-performing loan (NPL) ratio was unchanged at a historical low of 2.2% across the second half of 2025 (Chart 3.8, panel a). Balanced NPL inflows and outflows underpinned this stability, aided by NPL workouts, sales, securitisations and cures. Early warning indicators of asset quality also pointed towards continued stability, as the Stage 2 ratio declined to 8.9% and the early arrears ratio remained below 1.5%.
Loans to small and medium-sized enterprises (SMEs) are gradually emerging as a pocket of vulnerability in some countries. While loan default rates have decreased across sectors, SME loan defaults remain significantly above the levels seen shortly after the COVID-19 pandemic (Chart 3.8, panel b). Country-level trends differ notably, with German banks continuing to experience rising SME loan defaults since the previous edition of the Financial Stability Review was published (Chart 3.8, panel c). The share of weaker credit, such as forborne performing loans and Stage 2 loans, has also increased markedly for German and French banks, indicating the emergence of potential vulnerabilities in these countries (see Special Feature B).
Chart 3.8
Disaggregated data show emerging regional vulnerabilities in the SME sector
a) Aggregate NPL ratios and quarterly net NPL flows, by sector | b) Default rates for bank exposures, by sector | c) Default rates for SME loans, by country |
|---|---|---|
(Q1 2022-Q4 2025; € billions, percentages) | (Q1 2019-Q4 2025, percentages) | (Q1 2019-Q4 2025, percentages) |
 |  |  |
Sources: ECB (supervisory data) and ECB calculations.
Notes: Based on a full sample of euro area significant institutions. Panel a: NPL stands for non-performing loan; NFCs stands for non-financial corporations. Panels b and c: four-quarter trailing figures.
Commercial real estate (CRE) portfolios are stabilising, but differences across countries and a weaker economy require continued monitoring. Stabilisation reflects the generally improved financing conditions during the monetary policy easing cycle. However, vulnerabilities persist in those countries where bank exposures to the sector are significant, NPL ratios remain elevated and net NPL inflows are evident (Chart 3.9, panel a). The CRE sector is sensitive to macro-financial conditions and faces structural challenges, particularly with regard to non-prime and office properties (see Section 1.5). CRE asset quality therefore warrants continued monitoring. Any further escalation of geopolitical tensions could derail economic growth and increase interest rates, thereby affecting demand.
In the household sector, aggregate consumer NPL ratios have been slowly increasing since 2023. Loan growth has partially mitigated the impact of inflows on the NPL ratio (Chart 3.9, panel b). Going forward, this mitigating impact is likely to wane in light of the results of the most recent euro area bank lending survey, conducted by the ECB.[38] The survey indicated a tightening of credit standards by banks due to higher perceived risks and lower risk tolerance. It also pointed towards a strong reduction in demand due to lower consumer confidence and weaker spending on durable goods. Banks expect these trends to continue in the second quarter. Overall, aggregate unemployment in the euro area remains low and household resilience appears strong. However, any marked deterioration in economic conditions could have a negative impact on asset quality for consumer credit and mortgages, especially for credit granted to the most vulnerable households.
Chart 3.9
Continued monitoring warranted for CRE and consumer loans
a) NPL ratio vs net NPL flow rate for CRE loans and size of the CRE portfolio, by country | b) Consumer loans: NPL ratio and its components |
|---|---|
(Q4 2025, percentages) | (2023-25, percentages) |
 |  |
Sources: ECB (supervisory data) and ECB calculations.
Notes: Based on a full sample of significant institutions. NPL stands for non-performing loan. Panel a: the bubble size represents the share of CRE loans of total loans for the banks in the sample; yellow bubbles indicate banking sectors where CRE loans constitute more than 10% of total loans and blue bubbles those where they constitute less. Net NPL flows are normalised by total CRE loans for the NPL net flow rate. The net NPL flow rate is calculated as a trailing figure. Data for some countries are omitted due to confidentiality restrictions, given too few data points. Panel b: the components reflect the contribution of the change in NPLs and that of credit growth to the change in NPL ratios over the given time period.
A worsening macroeconomic environment and higher energy prices may weaken bank asset quality, even if direct exposures to geopolitical events remain limited. Geopolitical tensions, policy uncertainty or sudden market repricing could have adverse macro-financial effects and challenge the debt servicing capacity of firms and households. The direct exposures of euro area significant institutions to Middle East assets remain limited, accounting for around 0.6% of total assets (Chart 3.10, panel a). However, the debt servicing capacity of euro area borrowers is likely to weaken due to the higher cost of energy and raw materials, as well as lower aggregate demand. At the same time, uncertainties surrounding tariffs continue to weigh on economic activity, particularly in sectors reliant on the United States, with a potential impact on borrower credit risk and direct exposures to sectors such as US real estate.[39] In the case of both the war in the Middle East and tariff uncertainties, indirect effects are likely to matter more for bank asset quality in the euro area than direct exposures, and their impact will depend on the duration of the conflict and the severity of the related economic disruptions. Banks’ pre-provision operating profits, together with sizeable capital headroom, provide ample capacity to absorb increased credit losses. In fact, the aggregate annual pre-provision operating profits of the banking sector were more than four times loan loss provisions in 2025.[40] Loan loss provision flows have shown no significant response so far, although a slight increase in provisions for Stage 2 loans in the fourth quarter of 2025 – linked primarily to SME portfolios – may be a sign that banks are beginning to acknowledge rising credit risks (Chart 3.10, panel b).
Chart 3.10
Limited accumulation of provisions amid contained exposure to external shocks
a) Direct exposures of euro area significant institutions, by region | b) Loan loss provision flows and NPL coverage ratio |
|---|---|
(Q4 2025, percentages of total assets) | (Q1 2022-Q4 2025; € billions, percentages) |
 |  |
Sources: ECB (supervisory data) and ECB calculations.
Notes: Based on a full sample of euro area significant institutions. Panel a: country groupings are based on the classification of economies in the World Economic Outlook published by the IMF. “Middle East” comprises Algeria, Bahrain, Djibouti, Egypt, Iran, Iraq, Jordan, Kuwait, Lebanon, Libya, Mauritania, Morocco, Oman, Qatar, Saudi Arabia, Somalia, Sudan, Syria, Tunisia, United Arab Emirates, West Bank and Gaza, and Yemen. Panel b: four-quarter trailing figures.
3.4 Liquidity ratios and capital buffers have remained stable
Liquidity ratios remain high, while shrinking central bank liquidity has resulted in a compositional shift away from excess reserves towards sovereign bonds. Central bank liquidity is continuing to decline, already down by more than €2 trillion, or 45%, since its peak in 2022 (Chart 3.11, panel a), which also implies a substantial reduction in banks’ cash holdings. By contrast, banks have raised their total liquidity buffers slightly over the past calendar year, as they have replaced excess reserves with increasing amounts of mostly euro area sovereign bonds. The regulations governing liquidity coverage ratios classify euro area sovereign bonds and excess reserves as equally liquid. In practice, though, they differ in some other aspects: sovereign bonds usually offer a yield premium over the deposit facility rate, expose banks to valuation risk and may heighten concerns about the sovereign-bank nexus. However, a closer look at the sovereign bond portfolios held by euro area banks reveals a decline in home bias in most euro area countries (Chart 3.11, panel b), especially those with smaller fiscal deficits (see Section 1.2, Chart 1.3, panel a), which mitigates some concerns. Nonetheless, the growing reliance on sovereign bonds introduces a trade-off for banks, requiring them to balance enhanced liquidity buffers with increasing interest rate and credit risk exposures.
Chart 3.11
Liquidity ratios remain high, while HQLA composition shifts towards sovereign bonds
a) Euro area banks’ HQLA and LCRs | b) Share of domestic bonds in banks’ sovereign bond portfolios, by country |
|---|---|
(Q1 2017-Q4 2025; € trillions, percentages) | (Q4 2014-Q4 2025, percentages) |
 |  |
Sources: ECB (supervisory data) and ECB calculations.
Notes: Based on a full sample of euro area significant institutions. “Sovereign bonds” includes only level 1 sovereign bonds. HQLA stands for high-quality liquid assets; LCR stands for liquidity coverage ratio. Panel b: share of sovereign bonds issued by all global issuers. EA refers to the euro area aggregate.
Euro area banks have continued to improve their solvency ratios by retaining earnings and transferring credit risk to non-bank investors. CET1 ratios have reached a new high, further increasing capital headroom and contributing to banking sector resilience (Chart 3.12, panel a). This growth is being driven mainly by retained earnings, which contributed more than 0.7 percentage points to the increase in the solvency ratio over the last year. Capital relief from issuing synthetic risk transfers (SRTs) has also become more prominent (Chart 3.12, panel b).[41] Indeed, the total outstanding stock of SRTs in the second half of 2025 pushed up aggregate bank capital ratios by about 0.5 percentage points. The rapid growth of the euro area SRT market suggests that these instruments are gaining importance in banks’ capital management and that an increasing portion of corporate credit risk is being transferred from the banking sector to non-banks.[42] While this protects banks from credit losses and allows investors to enhance their portfolio allocations, banks may become overly dependent on the availability of risk-absorbing capital from SRT investors for new lending if this market continues to expand.
Chart 3.12
Banks’ capital ratios have increased further, with synthetic risk transfer issuance rising
a) Weighted average CET1 ratio and capital headroom of euro area banks | b) Euro area SRT market size and estimated impact on CET1 ratio |
|---|---|
(Q1 2019-Q4 2025, percentages of risk-weighted assets) | (H1 2021-H2 2025; € billions, percentage points of RWA) |
 |  |
Sources: ECB (supervisory data) and ECB calculations.
Notes: Based on a full sample of euro area significant institutions. Panel a: capital headroom is the difference between the implied CET1 capital need and banks’ actual CET1 ratios. The implied CET1 need is banks’ overall capital requirement + Pillar 2 guidance to be covered by CET1, plus any AT1/T2 shortfall that needs to be absorbed by CET1 and any eligible liability shortfall that must also be covered by CET1, accounting also for capital needs arising from leverage ratio and MREL regulations. Panel b: the retained portfolio is the portion that stays on banks’ balance sheets where banks continue to absorb credit losses, typically comprising the senior and first loss tranches, while the mezzanine tranche is transferred in the securitisation. The CET1 ratio increase is calculated as the difference in CET1 capital over pre- and post-securitisation risk-weighted exposure amounts (RWA). Pre-securitisation RWAs are calculated as unexpected portfolio losses, divided by 8% and multiplied by total portfolio value less actual post-securitisation RWAs. Where the (KSA) divided by 8% and multiplied by total portfolio value.
3.5 Geopolitical risks underscore the need for bank resilience to be a macroprudential priority
Geopolitical risks are materialising, but euro area banks are on a sound footing to cushion potential systemic shocks. The euro area banking sector is well capitalised, profitable and liquid (see Sections 3.1, 3.2 and 3.4). While there are pockets of deterioration in credit quality in some sectors and banking union countries (see Section 3.3), there are so far no signs of widespread loss materialisation or credit supply constraints due to banks’ capital positions.[43] Resilience within the banking union has increased, with all banking union countries having implemented some form of releasable capital buffer by early 2026. Since the previous edition of the Financial Stability Review, three countries have also increased their releasable capital buffers, and one country has decided not to extend a risk weight measure for bank mortgage loans.[44]
Maintaining bank resilience is a macroprudential priority in the current geopolitical situation. In a context of risks continuing to materialise, it is essential that existing releasable capital buffer requirements are maintained for as long as necessary to shield banks from any widespread loss materialisation and capital constraints on their lending activity. Having releasable buffers in place is extremely important in times when the economy is exposed to non-cyclical, supply-driven shocks, which reduce output and simultaneously drive up inflation. Only if buffers have been previously implemented can they be released to provide capital relief, allowing banks to absorb losses, prevent deleveraging and continue lending. Targeted increases in buffer rates may still be considered in countries with low releasable buffer requirements, provided that banking conditions are favourable and risks of procyclicality have abated.[45] The reduction of unwarranted heterogeneity in buffer rates for other systemically important institutions in the banking union will also strengthen the resilience of the banking system.[46]
Proactive macroprudential policy enhances complementarity with monetary policy in an uncertain economic environment.[47] In such an environment, macroprudential policy should remain firmly focused on safeguarding financial stability, and pressure to unduly relax capital requirements should be resisted.[48] At the same time, borrower-based measures should be used effectively to maintain sound lending standards, particularly in countries experiencing large increases in residential real estate prices.
The Governing Council endorsed 17 recommendations to address undue complexities in the European prudential framework. In March 2025 the Governing Council created the High-Level Task Force on Simplification (HLTF). Its objective was to identify undue complexities in the European regulatory, supervisory and reporting framework that may unnecessarily hamper the competitiveness of euro area banks. In December that year, the policy recommendations proposed by the HLTF were endorsed by the Governing Council and published in a report entitled “Simplification of the European prudential regulatory, supervisory and reporting framework”. The principles underpinning the HLTF recommendations are essential to ensure that any proposal to simplify the European prudential framework does not result in deregulation and is effective in promoting the sustained competitiveness of euro area banks. These principles relate to the need to (i) preserve the current levels of resilience, (ii) maintain effectiveness in meeting prudential objectives, (iii) foster European harmonisation and financial integration, and (iv) uphold international cooperation.
The Eurosystem supports reforms to enhance the competitiveness of EU banks, while preserving the resilience and stability of the financial system. In February 2026 the European Commission launched a targeted consultation on the competitiveness of the EU banking sector as part of its broad simplification agenda. The replies to this consultation will underpin the Commission’s report on the competitiveness of the EU banking sector, which is expected to be published in the second half of 2026. The Eurosystem’s reply is based on the HLTF report in its entirety, and its proposals complement the HLTF recommendations. The reply should therefore be read in conjunction with the HLTF report.[49]
The Eurosystem has called for completion of the banking union, a more efficient Single Market and a reduction in undue complexities in the regulatory framework. In the context of increasing geopolitical and geoeconomic fragmentation, the European Commission’s consultation provided a timely opportunity to consider, from a holistic perspective, what is needed to establish a truly integrated European banking market – a prerequisite for achieving the long-term economic objectives of the EU. The continued fragmentation of EU banking markets is holding European banks back from scaling up, realising economies of scale, competing both within and outside the EU, as well as limiting private risk sharing. The Eurosystem has made a strong call for synchronised progress on key banking union components, concrete steps towards the finalisation of a European Deposit Insurance Scheme, with a clear implementation timetable, and the promotion of deeper capital markets by advancing the savings and investments union. Work to strengthen the EU’s crisis management and deposit insurance framework should be coordinated and synchronised with efforts to deepen banking integration, namely a greater harmonisation of rules and the removal of barriers to the free flow of capital and liquidity in cross-border groups. This should be accompanied by adequate safeguards promoting resilience across the board for credit institutions and their subsidiaries, branches and consolidated groups, including through fair and timely transfers of resources within groups, particularly in times of stress.
Regarding macroprudential policy, the Eurosystem has called for fewer macroprudential buffers, as well as common principles and methodologies for their calibration, while preserving national competences. The main sources of complexity in the EU macroprudential framework stem from (i) the higher number of elements in the EU’s risk-weighted capital stack compared with the Basel standards, (ii) differences in the implementation of instruments across countries (also owing to differences in the transposition of the relevant provisions of the Capital Requirements Directive[50] into national legal frameworks), and (iii) the current reciprocity arrangements for different instruments. To address these complexities, the Eurosystem has made the following proposals: (i) merge the existing five macroprudential buffers into two buffers, namely a non-releasable buffer and a releasable buffer;[51] (ii) establish a harmonised macroprudential toolkit by refocusing from directives to regulations; and (iii) establish clear common principles and methodologies, including a single exercise, to calibrate all elements and avoid unwarranted overlaps or inconsistencies, while preserving national competences.
The EU has postponed the implementation of the Fundamental Review of the Trading Book (FRTB) to ensure a level playing field. This addresses concerns over delays in Basel III implementation by other major global jurisdictions. In November 2025 the European Commission launched a targeted consultation on the FRTB, focusing on policy options to be adopted by a delegated act offering specific changes to mitigate the capital effects for EU banks.[52] The ECB published its response to the targeted consultation on 15 January 2026.[53]
4 Non-bank financial sector

4.1 The non-bank financial sector weathers geopolitical risks
Non-banks have remained resilient, but the outbreak of the war in the Middle East has highlighted their vulnerability to correlated market downturns. After the start of the war, valuation losses in non-bank portfolios were initially more pronounced than those immediately following the Russian invasion of Ukraine. Equity markets fell and interest rate expectations shifted upwards, leading to a simultaneous decline in both bond and equity prices (Chart 4.1, panel a). This broad-based repricing was accompanied by a risk-off sentiment in fund flows, most notably in high-yield corporate bond funds. Both retail and institutional investors reduced their holdings of investment fund shares exposed to higher market and credit risk. Unlike in other episodes of abrupt market adjustments over the past few years, the reaction of insurance corporations and pension funds was similar to that of investment funds, while outflows from funds with a household investor base were again less severe (Chart 4.1, panel b). While non-banks have so far absorbed losses without major disruptions, episodes of abrupt and correlated price declines can quickly translate into liquidity stress. In such environments, valuation losses can trigger fund share redemptions and margin calls. The resulting procyclical asset sales can amplify market downturns and generate spillovers across asset classes and sectors.
Chart 4.1
Non-banks experienced correlated valuation losses and procyclical risk‑asset outflows following the outbreak of the war in the Middle East
a) Estimated short-term impact of geopolitical shocks on non-bank equity and bond portfolio valuations | b) Estimated equity and high-yield bond fund flows during selected shock episodes, by investor group |
|---|---|
(24 Feb.-11 Apr. 2022, 2 Mar.-24 Apr. 2026; days after start of conflict, € billions, percentages of total holdings) | (percentages of total net assets) |
 |  |
Sources: EPFR Global, ECB (CSDB, SHS) and ECB calculations.
Notes: Panel a: estimated portfolio losses approximated on the basis of portfolio composition at the end of the previous quarter and daily changes in benchmark bond and equity prices following the start of the respective conflict. Only business days are included, starting from the onset of each event. Panel b: average 20 business day cumulative flows into euro area-domiciled equity and high-yield corporate bond funds after 7 March 2022 (euro area fund outflows following the invasion of Ukraine), 2 April 2025 (US tariff shock) and 28 February 2026 (start of Middle East war). Investor base for funds assigned on the basis of the largest holder sector.
Non-bank portfolios remain exposed to further valuation risks, given still elevated prices, concentrated holdings and macro-financial uncertainties. Despite the sharp adjustment in bond and equity markets following the start of the war in the Middle East, portfolio valuations of many non-bank entities are still high by historical standards, with equity holdings increasingly concentrated in a small number of firms (Chart 4.2, panel a). In a context of elevated geopolitical risk, sudden changes in the macroeconomic outlook, interest rate expectations or credit risk could trigger renewed price declines across a broad range of assets. Concentration risks are compounded by the fact that a large share of equity exposures is to US companies, notably AI‑related firms whose valuations are closely tied to a continued positive AI narrative (see Chapter 2 and Box 4). This exposes euro area non‑banks not only to equity market repricing but also to exchange rate risk. In 2025 US dollar depreciation implied around €150 billion of valuation losses on US equity holdings, which were offset by strong price increases that later reversed after the outbreak of the war in the Middle East. While overall holdings still rose, net purchases of US equities by euro area non-banks stalled in the second half of 2025 (Chart 4.2, panel b). Recent pressures on US private credit entities have also highlighted that exposures to private markets can represent an additional source of risk in non-bank portfolios. Private markets are characterised by complex leverage structures, opaque valuations and limited liquidity, making them susceptible to abrupt and potentially sizeable valuation adjustments when risk sentiment deteriorates (see Section 4.2 and Special Feature D).
Chart 4.2
Non-bank portfolio valuations remain elevated and concentrated in US equities despite recent price declines and foreign exchange losses in 2025
a) Non-banks’ equity and bond portfolio valuations and equity concentration | b) Cumulative changes in euro area non-banks’ USD equity holdings |
|---|---|
(Q1 2016-Q1 2026E; z-scores, percentages) | (Q1 2024-Q1 2026E, € trillions) |
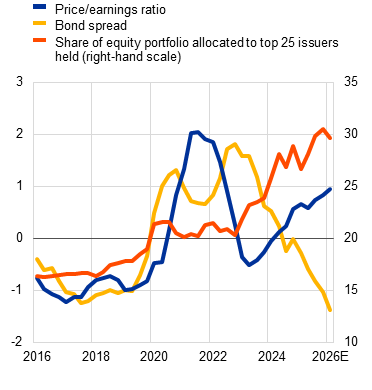 | 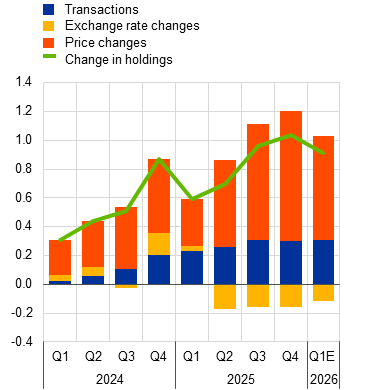 |
Sources: EPFR Global, Bloomberg Finance L.P., ECB (CSDB, SHS, EXR) and ECB calculations.
Notes: Q1 2026 values are estimates. Panel a: holdings are projected by repricing the Q4 2025 portfolio composition using the latest available Q1 2026 prices. Changes in estimated Q1 concentration therefore reflect only relative asset price movements, not active portfolio management. The price/earnings ratio calculation is limited to non-bank holdings within the S&P 500, STOXX Europe 600, Nikkei 225 and FTSE 100 indices, accounting for their changing compositions over time. The metric used is the 12-month forward price/earnings ratio. The spreads are calculated as the difference between an individual security’s yield to maturity and a corresponding benchmark rate. Euro-denominated holdings are benchmarked against the euro area ten-year government benchmark bond yield while US dollar and all other currency holdings are benchmarked against the ten-year US Treasury yield. Each security’s yield is compared with a common ten-year benchmark, regardless of its individual maturity. Panel b: total holdings are calculated by repricing the Q4 2025 portfolio using the latest available Q1 2026 prices, while transaction estimates are based on Q4 2025 transaction volume scaled by the percentage flows (as a share of total net assets) into US equities reported by euro area-domiciled funds during Q1 2026.
Shifts in interest rate expectations and macroeconomic uncertainty may lead non-banks to adjust their portfolios and may increase risks from margin calls. The steepening of the yield curve in the course of 2025 has been accompanied by changes in investors’ maturity preferences, with non-banks increasingly shifting towards short-term bonds (see Box 2). As a result, non-banks – primarily money market and other investment funds – have become more important investors in short-term euro area sovereign bond markets (Chart 4.3, panel a). While this may broaden the investor base and reduce duration risk in non-bank portfolios, insurance corporations and pension funds in particular remain vulnerable to liquidity shocks stemming from margin calls on derivative positions (see Section 4.3). During March, the variation margin posted by non-banks on interest rate derivatives increased as interest rate expectations shifted upwards, but the rise has so far remained contained relative to the initial margin (Chart 4.3, panel b). By contrast, the variation margin on foreign exchange derivatives has risen substantially with the spike in geopolitical risk after the outbreak of the war in the Middle East. Higher volatility in financial markets may increase both the need for hedging and the need for liquidity preparedness, which may be costly. In a more volatile macro-financial environment, sudden price adjustments can lead to more frequent spikes in variation margin and collateral calls. This may add to existing liquidity needs, prompting asset sales and amplifying price dynamics across markets.
Chart 4.3
Non-banks’ role in short-term sovereign bond markets increases, while macroeconomic uncertainty raises the risk of margin calls
a) Euro area investor base for euro area short-term sovereign bonds | b) Non-banks’ variation margin over initial margin posted, by derivative type |
|---|---|
(Q1 2021-Q4 2025, € billions) | (1 Nov. 2025-30 Apr. 2026, variation margin/initial margin) |
 |  |
Sources: ECB (SHS, EMIR) and ECB calculations.
Note: Panel a: MMF stands for money market fund.
Box 4
Drivers of investor behaviour in highly valued equity markets
Asset price valuations are particularly high in the technology and artificial intelligence (AI) sectors, where euro area investors have significant exposures. Price/earnings ratios remain historically elevated across many equity markets, with US equity indices trading at notably higher levels than their European counterparts (Chart A, panel a). While euro area investors have doubled their holdings of all equities in the past decade, their holdings of US equities have quadrupled, driven both by positive valuation effects and asset purchases.[54] The investment fund sector is the single largest euro area holder of equities overall and of US stocks in particular (Chart A, panel b). This concentration places investment funds at the centre of euro area exposures to assets with stretched valuations. Analysing investor flows into funds focused on such asset classes can, therefore, help gain an understanding of the observed drivers of the high market valuations and the associated financial stability risks.
More4.2 Investment fund flows remain sensitive, with private credit adding further risk
The recent outbreak of war in the Middle East has led to significant flow responses in investment funds. The investment fund sector is generally highly sensitive to geopolitical shocks. Empirical analyses suggest that especially severe geopolitical shocks lead, on average, to outflows of 3.6% of total net assets from equity funds and 4.3% from corporate bond funds within six months (Chart 4.4).[55] Following the Russian invasion of Ukraine, the actual equity fund flow response was benign by historical standards, while the corporate bond fund flow response exceeded model predictions. Since the outbreak of the war in the Middle East, both equity and corporate bond funds have faced outflows, as expected, although the magnitudes of such outflows have so far been relatively limited. Past experience suggests that more outflows are likely in the future as economic consequences materialise, especially if the war continues for longer than financial markets expect.
Chart 4.4
Investment funds see flows out of risky assets and into safe-haven sovereign bonds when geopolitical risk materialises
Impulse responses of euro area-domiciled fund flows to severe geopolitical risk shocks, by fund investment policy
(Jan. 2002-Dec. 2023; months after shock, percentage shares of total net assets)
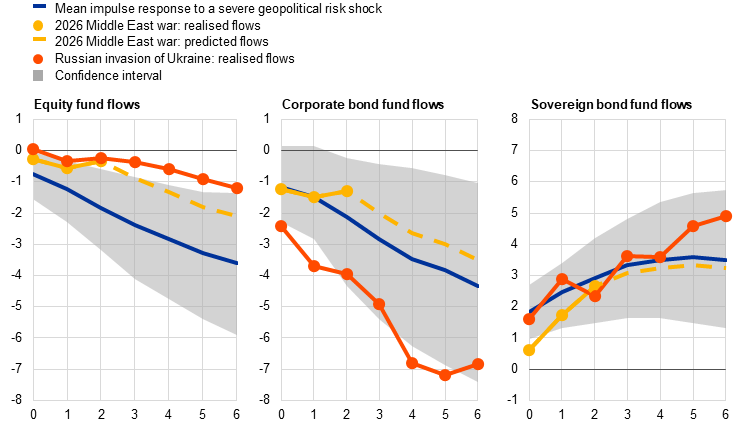
Sources: ECB (SHS, CSDB), EPFR Global, Bloomberg Finance L.P. and ECB calculations.
Notes: Impulse responses to a severe global geopolitical shock of 6 standard deviations (Caldara and Iacoviello*), based on a Bayesian vector autoregression model with monthly data from January 2002 to December 2023 as presented in Dieckelmann et al.** All responses are based on separate model estimations that include the geopolitical risk index, one category of cumulative flows into euro area-domiciled equity or bond funds, the VSTOXX index, the EURO STOXX 50 index and the two-year Bund rate. The shocks are identified using a Cholesky decomposition, with geopolitical risk ordered first. All values statistically significant at levels of at least 10%. The latest observations for realised flows in 2026 are for 19 May 2026.
*) Caldara, D. and Iacoviello, M., “Measuring Geopolitical Risk”, American Economic Review, Vol. 112, No 4, April 2022, pp. 1194-1225.
**) Dieckelmann, D., Kaufmann, C., Larkou, C., McQuade, P., Negri, C., Pancaro, C. and Rößler, D., “Turbulent times: geopolitical risk and its impact on euro area financial stability”, Financial Stability Review, ECB, May 2024.
Opacity and declining investor sentiment may expose liquidity vulnerabilities in funds as demand for riskier credit assets, including private credit, weakens. High-yield bond fund flows quickly turned to net outflows after the start of the war in the Middle East, more so than investment-grade bond fund flows (Chart 4.5, panel a). The combination of high credit risk and illiquid underlying assets is particularly suited to exposing liquidity mismatches in the investment fund sector. Declining valuations tend to prompt redemption requests that may exceed available liquidity. Such risks have recently materialised in inherently illiquid private credit markets in the United States. There, open-ended or semi-open-ended private credit funds and business development companies have experienced sizeable redemption requests that have often exceeded redemption gates (see Overview).
Chart 4.5
Risk-off sentiment strongly affects high-yield corporate bond and private credit funds, with the latter facing high credit risk, especially in the software sector
a) Cumulative flows into European bond funds | b) Share of payment-in-kind loans in US business development companies |
|---|---|
(16 Feb.-19 May 2026; days before/after outbreak, percentage shares of total net assets) | (Q2 2023-Q3 2025, percentages) |
 |  |
Sources: EPFR Global and S&P Global Ratings Private Markets Analytics.
Notes: Panel a: “Start of Middle East war” refers to 2 March 2026, the first trading day after the initial strikes on Iran on 28 February 2026. 0 on the x-axis marks the event date and other values indicate the business days before and after the event. Fund flows are cumulative and rebased to zero on the last trading day before the war (27 February).The sample is based on globally domiciled funds investing primarily in Western European bonds, which include bonds issued in Austria, Belgium, Denmark, Finland, France, Germany, Greece, Ireland, Italy, the Netherlands, Norway, Portugal, Spain, Sweden, Switzerland, United Kingdom. Panel b: the chart shows the share of loan assets making payments in kind (PIK) in total loan assets (at fair value) across all business development companies (including publicly traded, non-traded and interval funds) and compares it with the share of PIK loans in the software sector and related sectors (IT services and healthcare technology).
In the euro area, 79% of private credit funds are closed-ended as of the end of 2024 while the remaining funds allow for redemptions, exposing them to liquidity risk.[56] Beyond liquidity mismatches, concentrated lending exposures, interlinkages with other financial institutions and public credit conditions, opaqueness and complex leverage structures can be important shock amplifiers (see Special Feature D). Elevated credit risk increases the likelihood of further redemptions going forward. Business development companies, and likely also other private credit funds, are characterised by a high share of payment-in-kind (PIK) loans, indicating potential cash flow strains.[57] Additionally, a substantial share of the loans held by such companies are to software firms, whose business models could suffer from severe AI disruption. In this case the share of PIK loans is much higher than in the aggregate loan portfolio (Chart 4.5, panel b).
Rising leverage and insufficient liquidity preparedness remain concerns for financial stability in parts of the investment fund sector. Leverage and strong interlinkages with the broader financial system are major financial stability risks posed by global hedge funds, which continue to lever up (Chart 4.6, panel a). In particular, the largest hedge funds maintain leverage ratios that are significantly above average. Relative value strategy funds tend to engage in highly leveraged basis trades, including in European sovereign bond markets, and have leverage ratios of around 25. Their leveraged positions may have to be unwound quickly if bond prices react sharply to geopolitical or risk sentiment shocks, for instance. In this way, hedge funds’ procyclical deleveraging could exacerbate ongoing price moves and, through increased volatility in bond markets, erode the stable funding base of European governments.[58] Hedge funds domiciled in the euro area have also increased their financial leverage in the past few years, albeit with a slight decrease in the very recent past, but the level of their leverage remains below that of US hedge funds. Risks may be compounded by synthetic leverage in the form of derivatives, which can quickly translate into liquidity stress once market adjustments trigger margin or collateral calls.
Chart 4.6
The largest hedge funds keep on levering up, while continuously low cash buffers in the investment fund sector increase the risk of forced asset sales in stress periods
a) Financial leverage ratios of US and euro area-domiciled hedge funds | b) Euro area bond funds’ cash holdings |
|---|---|
(Q1 2023-Q4 2025, ratio of total assets to own funds) | (Jan. 2025-May 2026; percentage shares of total assets, index) |
 | 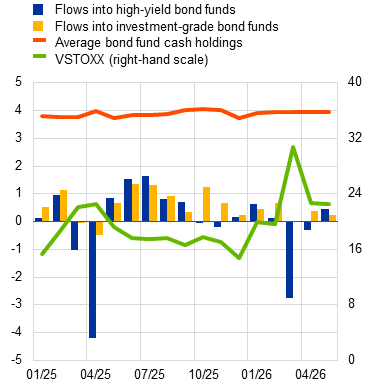 |
Sources: US Office of Financial Research, ECB (IVF), EPFR Global and Bloomberg Finance L.P.
Note: Panel b: the latest observation in the May series is for 19 May 2026.
Cash buffers in euro area investment funds have continued to decline overall. Sufficient liquidity levels – in the form of cash or other high-quality liquid assets (HQLA) – are essential to ensure resilience when facing liquidity shocks. HQLA holdings have generally declined over time[59], with cash levels further decreasing from slightly below 6% of total assets in bond funds and 4% in equity funds in the first quarter of 2020 to around 4% and 2% respectively in the first quarter of 2026. Several stress episodes in the past two years were marked by strong outflows, especially out of high-yield bond funds (Chart 4.6, panel b). During the tariff turmoil in April 2025, outflows from high-yield bond funds exceeded average cash buffers, indicating that these funds may have had to resort to precautionary or even forced asset sales to meet redemption requests. Such behaviour, especially in relatively illiquid assets like high-yield bonds, can exacerbate price movements. In turn, these can trigger margin calls or further redemptions elsewhere, amplifying aggregate financial stress. It is therefore a top priority for investment funds to ensure they maintain adequate liquidity levels and appropriate redemption terms to reduce liquidity mismatches (see Section 4.4).
4.3 Resilient insurance and pension fund sectors face volatile markets
Euro area insurance corporations and pension funds entered the latest episode of heightened geopolitical tensions with robust balance sheets and capital positions. The median solvency ratio of insurance corporations has remained above 200% – considerably above regulatory minima – providing a significant buffer to absorb potential losses (Chart 4.7, panel a). Profitability remains strong, although it may moderate in 2026 owing to competitive pressures, higher insurance rates and rising operational costs.[60] Pension funds’ funding ratios have been supported by strong investment returns, rising equity prices and higher long-term interest rates, which have reduced the value of pension liabilities.[61]
Euro area insurance corporations’ risks arising from insurance related to property and activities in the Middle East are contained. While euro area insurance corporations and reinsurers have some exposure to vessels and infrastructure in the Middle East, such risks are generally limited to specialised, globally distributed portfolios and do not represent a core systemic vulnerability. Reinsurance coverage and terms have tightened in response to war-related risks, while a prolonged conflict could negatively affect insurance corporations’ balance sheets through higher costs relating to insurance claims and asset-side challenges.
The war in the Middle East has introduced heightened market volatility and increased valuation risk for investment portfolios. Direct exposures to markets in the region remain small. In 2025, on average only 0.07% of securities held by euro area insurance corporations and 0.10% of those held by euro area pension funds were issued by issuers based in Middle Eastern jurisdictions.[62] However, global markets are affected by the war in the Middle East and euro area insurance corporations and pension funds are invested in these markets. As a result, their portfolios are subject to market volatility and credit risk stemming from disruptions to oil exports and trade flows, as well as to weakening economic growth in general.
Chart 4.7
Insurance corporations’ solvency ratios and pension funds’ funding ratios remain strong and able to cater for risks from alternative or illiquid assets
a) Solvency measures for EEA insurance corporations and pension funds | b) Share of selected alternative assets in total assets held by euro area insurance corporations and pension funds |
|---|---|
(Q1 2021-Q3 2025, percentages) | (Q4 2022-Q4 2025; € billons, percentages) |
 | 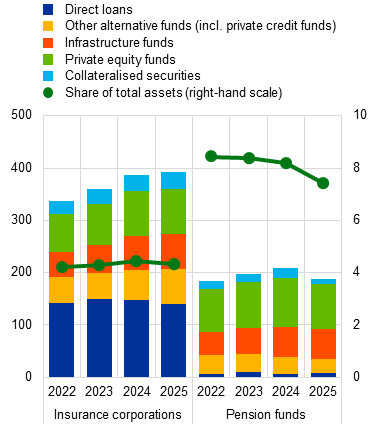 |
Sources: EIOPA and ECB calculations.
Notes: Panel a: the chart uses data from the European Insurance and Occupational Pensions Authority (EIOPA) and shows medians for all insurance corporations and pension funds based in the European Economic Area (EEA). Insurance corporations are subject to Solvency II*, which requires a minimum solvency capital ratio of 100%. Pension funds, by contrast, follow the IORP II framework**, which does not set a uniform EU‑wide funding ratio; national authorities define their own funding rules, typically requiring sufficient assets and recovery plans when schemes are underfunded. The funding ratio is defined as the ratio of assets to technical provisions. Panel b: “Pension funds” includes only occupational pension funds; “Direct loans” excludes mortgages; “Other alternative funds” covers alternative funds as categorised by EIOPA, which also includes private credit funds. The series refer to year-end data. Alternative assets in previous editions of the Financial Stability Review included real estate exposures, which have been excluded here. This was done to align more closely with the EIOPA methodology used to derive private credit exposures.
*) Directive 2009/138/EC of the European Parliament and of the Council of 25 November 2009 on the taking-up and pursuit of the business of Insurance and Reinsurance (Solvency II) (OJ L 335, 17.12.2009, p. 1).
**) Directive (EU) 2016/2341 of the European Parliament and of the Council of 14 December 2016 on the activities and supervision of institutions for occupational retirement provision (IORPs) (OJ L 354, 23.12.2016, p. 37).
Insurance corporations and pension funds have exposures to illiquid assets that could give rise to additional risks. As of the third quarter of 2025, alternative assets (such as private credit, private equity and infrastructure) accounted for 4.4% and 6.6% of the total assets of insurance corporations and pension funds respectively. Since 2022 the trend has been slightly upwards for insurance corporations and downwards for pension funds (Chart 4.7, panel b).[63] Private credit and other alternative investment exposures pose challenges related to valuation uncertainty, given the illiquidity of these asset classes. In addition, it might not be easy to sell such assets in the event of urgent need. Lastly, incomplete data reporting creates transparency issues.
Chart 4.8
Insurance corporations and pension funds actively implement hedging strategies to protect their balance sheets
a) Gross notional derivatives exposures of insurance corporations and pension funds, by business type | b) Net currency hedging |
|---|---|
(31 Dec. 2025, € trillions) | (Q4 2024-Q1 2026, € billions) |
 | 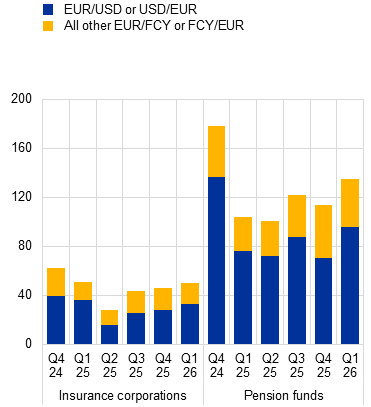 |
Sources: ECB (EMIR) and ECB calculations.
Notes: Panel b: net currency hedging is the net notional amount expressed in euro summed across all types of FX derivatives. For each sector, net currency hedging is shown for EUR/USD transactions alone and for all net currency hedging positions aggregated across EUR/FCY positions. FCY stands for foreign currency.
Euro area insurance corporations and pension funds may face margin calls from hedging activities used to mitigate risks. Life-insurance corporations primarily hedge interest‑rate risk because their liabilities are long dated and interest sensitive. Pension funds hedge foreign currency risk because their liabilities are single‑currency while their assets are global, whereas reinsurers hedge foreign currency risk because their liabilities are multi‑currency while their assets are concentrated in only a few currencies (Chart 4.8, panel a). Insurance corporations have increased their net currency hedging positions to protect euro-denominated balance sheets against US dollar fluctuations. This has notably been the case since the second quarter of 2025, whereas pension funds have only recently started to increase their net hedging positions again after the fall seen between the third and fourth quarters of 2025 (Chart 4.8, panel b). During times of macroeconomic uncertainty or elevated market volatility, hedging strategies may expose firms to a greater likelihood of margin calls, potentially leading to significant liquidity pressures.
4.4 Enhanced NBFI macroprudential and supervisory frameworks are key to developing EU capital markets
Concerns about leverage, liquidity mismatch and opacity in non-bank financial intermediation (NBFI) underline the need to enhance resilience within the sector. Vulnerabilities related to leverage, liquidity mismatch and opacity were evident in past crisis episodes, including the March 2020 market turmoil, the 2021 collapse of Archegos and the 2022 UK gilt market stress. Against a backdrop of elevated asset valuations, geopolitical risk and opacity in private credit markets, there are growing concerns that the NBFI sector could amplify market stress. Timely and consistent implementation of international reforms in the EU is essential to enhance resilience.
A number of international recommendations aimed at mitigating liquidity risk in the NBFI sector have yet to be fully implemented in the EU. International efforts are advanced when it comes to developing standards addressing liquidity risks from the NBFI sector. More work, however, is needed in the EU. The proposals put forward by the Financial Stability Board (FSB) in 2021 to enhance the resilience of money market funds have yet to be fully implemented. A key issue is how to reduce liquidity mismatch in the sector by increasing holdings of liquid assets, while ensuring that liquidity buffers remain usable in periods of stress.[64] With regard to the implementation of FSB work on open-ended funds, more work is needed on classifying funds according to the liquidity of their assets. Lastly, the EU has yet to implement the FSB’s 2024 recommendations on enhancing the liquidity preparedness of NBFI participants when facing margin and collateral calls during times of market-wide stress.
Given the cross-border nature and opacity of certain NBFI activities, addressing leverage risks requires a global approach. A key component of the FSB’s recommendations on NBFI leverage requires authorities to improve their risk monitoring frameworks by enhancing data availability and risk metrics. Given the presence of significant blind spots, authorities can only reach this goal through international cooperation aimed at increasing the visibility of cross-border risks. The work done by the FSB to address data challenges is critical, particularly with regard to removing barriers to effective cross-border data-sharing and strengthening public disclosures. In respect of policies addressing leverage risks, the FSB’s recommendations call for a combination of entity-based measures (such as leverage limits) and activity-based measures (such as margins and minimum haircuts). These curb procyclical leverage dynamics and reduce regulatory arbitrage. Additional guidance from the FSB is needed to help authorities put these recommendations into practice. A key issue is how best to address risks from complex leveraged strategies – this is a concern in the euro area given the growing presence of hedge funds in sovereign bond markets (see Box 2).
The EU’s efforts to develop private markets and enhance supervision as part of the savings and investments union have been well received. Progress on the savings and investments union is urgently needed to strengthen Europe’s competitiveness, strategic autonomy and financial stability, while supporting the efficient financing of the real economy. Several key initiatives are under way in the EU to develop private markets and mobilise retail savings and institutional investors’ capital more effectively. These include reviewing regulatory frameworks (e.g. revised rules for European Long-Term Investment Funds, the EU venture and growth capital funds reform) and boosting institutional investors’ involvement (e.g. Solvency II and IORP II for insurance corporations and pension funds). Efforts are also under way to remove barriers restricting the cross-border integration of the European asset management sector. These initiatives are welcome and in line with the Governing Council’s calls for urgent progress towards achieving a single market for capital.[65] A more integrated supervisory framework, including enhanced coordination and additional supervisory convergence powers for the European Securities and Markets Authority (ESMA) would help to ensure the consistent treatment of risk, promote a level playing field and reduce the potential for regulatory fragmentation or arbitrage.[66]
A more integrated framework for supervising funds and asset managers should be accompanied by amendments to the macroprudential framework. Further integration of the asset management industry and capital markets also entails a higher risk of cross-border contagion in the financial system. To fully gain the benefits of the savings and investments union, capital markets should be a resilient and sustainable source of financing, even in times of stress. This requires a prudential framework that can detect and address emerging systemic risk across the financial system. The review of the supervisory framework for asset management should be accompanied by a review of the macroprudential framework.[67] This would include targeted amendments to the Undertakings for Collective Investment in Transferable Securities (UCITS) Directive[68] and the Alternative Investment Fund Managers Directive (AIFMD)[69]. Key priorities, based on Eurosystem views, include introducing reciprocation mechanisms and granting “top-up” powers to ESMA in collaboration with national authorities and after consulting with the European Systemic Risk Board. The reciprocation framework should be primarily voluntary and should allow for a “comply or explain” process. There is also a need for a dedicated tool which could be used to address structural liquidity mismatch in open-ended funds. This would be similar to the existing legislative power to address systemic risk stemming from excessive leverage (see Article 25 of the AIFMD). Such a tool should allow authorities to address systemic risk ex ante, for example, by specifying longer notice periods for particular cohorts of funds.
As capital markets develop and the financial system evolves, so too will data needs for accompanying systemic risk assessments. To underpin a macroprudential approach to NBFI, it is important that authorities with a macroprudential mandate have direct access to granular data on non-banks. However, fragmented data continue to impede the assessment of systemic risk, both domestically and across borders. New sectors and market dynamics are emerging, as seen by the rapid growth of private credit markets. Opacity is therefore a key concern and relying on existing data might not be sufficient. Within the EU, there are three areas where progress is needed.[70] First, targeted legislative changes to data access and sharing provisions under the relevant EU regulations would enable euro area authorities to speedily exchange (including across borders) NBFI statistical and regulatory data. Second, a centralised data access and sharing mechanism is needed, with direct data still collected at the national level.[71] Third, existing reporting should be strengthened, especially for more opaque segments of the NBFI sector such as private credit. Enhanced data would also facilitate the development of system-wide stress testing, which would complement existing sectoral stress tests. At the global level, ongoing work by the FSB to improve the availability (including cross-border sharing) and comparability of NBFI data is critical.
Addressing data gaps in private credit markets is key to supporting authorities’ ability to identify risks and protect investor confidence in private markets. Risks related to euro area investors’ exposures to US private credit funds could erode confidence in private asset classes, which would undermine the objectives of the savings and investments union. EU supervisors should pay particularly close attention to these risks, actively strengthening resilience and protecting investors within their mandate and existing regulatory frameworks. However, data limitations could hamper their ability to assess financial stability risks in private credit, where vulnerabilities related to leverage, liquidity mismatch and opacity could all materialise at the same time. International efforts are needed to close data gaps and develop consistent definitions and taxonomies that enhance cross-jurisdictional comparability. In the EU, it is important to enhance cross-sectoral data access and introduce a specific alternative investment fund type dedicated to private credit funds. From a regulatory perspective, several frameworks apply to private credit funds in the EU, including leverage limits for loan origination funds under the AIFMD and liquidity rules under the European Long-Term Investment Funds Regulation.[72] This may imply that these frameworks have helped limit the build-up of risk in EU-domiciled funds. However, not all private credit activities are captured by these frameworks, and additional safeguards may be warranted from both a financial stability and an investor protection perspective. Liquidity mismatch in semi-liquid or evergreen structures should be addressed by ensuring that redemption terms align more closely with asset liquidity. This could be achieved through longer minimum notice periods and reduced redemption frequencies. Issues in private credit markets also raise important questions about the suitability of open-ended structures for funds invested in inherently illiquid assets. It may be necessary to reassess recent regulatory changes which allow this.[73] Supervisors should also identify the share of private credit funds that fall outside the definition of loan origination funds under the AIFMD, which therefore are not subject to the associated leverage limits. Supervisors should take appropriate action where such funds pose systemic risks.
A resilient global financial system based on an international level playing field is necessary for sustainable economic growth. The tensions outlined above come at a time when authorities are undertaking reviews of their regulatory and supervisory frameworks. The FSB has a key role to play in ensuring that such efforts do not lead to a “race to the bottom” or fragmentation in the implementation of its recent initiatives. A significant part of international policy work over the past decade has, in principle, focused on “modernising” regulatory and supervisory frameworks to ensure that they are resilient to an evolving financial system. This work includes addressing vulnerabilities stemming from the growth of NBFI, the emergence of new asset classes, such as crypto-assets and stablecoins, climate-related risks and cyber threats.
Box 5
Assessing the macroprudential impact of liquidity management tools for investment funds: a system-wide analysis
Liquidity mismatches in open-ended funds can generate systemic risk when redemption pressures meet illiquid markets. During stress episodes, large outflows may force rapid asset sales at discounted prices. As asset values fall, investors may accelerate redemptions to avoid losses, creating run-like dynamics. Such feedback loops between outflows and prices can transmit localised stress to the broader financial system.[74] A number of liquidity stress episodes over the past few years have highlighted vulnerabilities in the fund sector. For example, the financial turmoil that followed the outbreak of the COVID-19 pandemic led to around 140 investment funds domiciled in the European Economic Area suspending redemptions due to valuation uncertainty or excessive outflows between March and May 2020.[75]
MoreSpecial features
A From dictionaries to AI: a new era in sentiment analysis for financial stability
Financial stability communication is challenging because its task is not to forecast financial crises, let alone predict their precise timing. Rather, it is to identify vulnerabilities and explain how the financial system is likely to fare should it be confronted with adverse shocks. Great care is needed in this endeavour, because the sentiment of financial stability communication can influence market perceptions and risk assessments, as well as broader economic and financial outcomes. Given the presence of this potential feedback loop, the task of financial stability communication at the ECB has long been guided by a broad concept of financial stability: the smooth allocation of financial resources, effective management of risk by financial institutions and the capacity of the financial system to absorb shocks. Using the messages conveyed in the ECB’s Financial Stability Review over two decades, this special feature compares dictionary-based, FinBERT and prompt-based AI approaches to extracting financial stability sentiment. It finds broad co-movement across methods, while the GPT-based filter isolates sentences that contain explicit risk assessments, capturing subtle shifts in tone and context that were previously difficult to quantify. Used carefully, such tools can support risk monitoring and drafting consistency over time, but they remain complementary to expert judgement, vulnerability analysis and stress testing, rather than substitutes for it. A deep-dive box in the special feature also shows how AI can be used to systematically extract information from financial news to create an indicator for the severity and probability of triggers (SPOT) for financial stability risks.
MoreB Rising bankruptcies, resilient loan books: unpacking euro area corporate credit risk
Corporate bankruptcies in the euro area have been on the rise, but the aggregate asset quality of banks’ corporate lending has remained broadly stable. This special feature analyses this divergence and its implications for financial stability. It shows that rising bankruptcies may partly be explained by the normalisation of firm turnover since the COVID-19 pandemic, albeit with marked cross-country unevenness. At the same time, firm-level evidence suggests that balance sheet and profitability challenges are concentrated in a vulnerable tail of firms, but have remained stable for the average euro area company. Structural changes in corporate financing, including a declining reliance on bank loans and a larger role for equity, debt securities and non-bank lending, imply that a greater share of corporate risk might be outside the banking system. The analysis also shows that broadly stable aggregate asset quality reflects diverging trends in loan performance across countries and firm sizes, as well as banks’ proactive management of non-performing loans. Overall, it does not find any systematic evidence for banks delaying the recognition of non-performing loans in their loan books. Instead, the analysis indicates that weaker firm fundamentals result in a higher probability of bank exposures being reclassified from performing to non-performing.
MoreC House price booms and policy choices: insights from a meta-regression analysis
This special feature examines policy-assignment dilemmas facing macroprudential authorities when housing markets boom: which instruments work best, on which objectives, and in combination with which other tools? It does so by revitalising Mundell’s Principle of Effective Market Classification,[76] the policy-space analogue of Ricardo’s comparative advantage principle, and by applying it to macroprudential policy. The analysis uses a novel G-search literature-search algorithm and an AI-supported, replicable data-extraction system to assemble estimates of policy-impact parameters from the empirical literature. It then distinguishes standard, instrument-by-instrument evidence, from jointly estimated policy-impact parameters, which are needed to account for rival instruments acting in the same empirical setting. Three findings emerge. First, the results confirm earlier meta-analytic evidence that macroprudential policy moderates household credit growth more clearly than it does house price growth, that tightening has more visible effects than loosening, and that instruments differ in their strengths and weaknesses. Second, joint estimates sharpen policy-assignment analysis by revealing how relative effects change when instruments are assessed together rather than alone. Third, applying the Mundell framework identifies instrument pairings that satisfy necessary conditions for substitutability or complementarity. Overall, the menu of options available to effectively tame housing market booms is wide, provided instruments are assigned to objectives by their relative – not absolute – effectiveness.
MoreD Stress in global private credit markets and its implications for euro area financial stability
Recent stress in parts of the US private credit market − including concerns about exposures in the software sector and redemption pressure in semi-liquid vehicles − has led to renewed focus on possible financial stability risks stemming from private credit and the potential relevance of such risks for the euro area. This special feature looks at the exposure of the euro area financial system to private credit. Using available commercial, public and proprietary data, it finds that euro area financial institutions appear to have limited direct exposure to private credit. This makes it unlikely that private credit in isolation could be a source of systemic financial instability at present. However, insurance corporations and pension funds in particular could, in an adverse scenario, face more material second-round revaluation losses from broader spillovers to leveraged loans, high-yield bonds and equities. Private credit could promote long-term growth by channelling funds from long-term investors to innovative firms, thereby supporting the objectives of the EU’s savings and investments union. The market should nonetheless be monitored closely, especially in view of worsening credit quality, possible expansion into retail-oriented structures and a potential role of private credit in AI-related financing. Reducing private credit’s opacity, addressing data gaps and working towards a harmonised definition of private credit at a global level would avoid a potential underestimation of direct exposures and enable risk to be assessed more completely.
MoreAcknowledgements
The Financial Stability Review assesses the sources of risks to and vulnerabilities in the euro area financial system based on regular surveillance activities, analysis and findings from discussions with market participants and academic researchers.
The preparation of the Review was coordinated by the ECB’s Directorate General Macroprudential Policy and Financial Stability. The Review has benefited from input, comments and suggestions from other business areas across the ECB. Comments from members of the ESCB Financial Stability Committee are gratefully acknowledged.
The Review was endorsed by the ECB’s Governing Council on 20 May 2026.
Its contents were prepared by Desislava Andreeva, Peter Bednarek, Katharina Cera, Daniel Dieckelmann, John Fell, Sándor Gardó, Katri Mikkonen, Diego Moccero, Charles O’Donnell, Allegra Pietsch, Manuela Storz, Pucho Vendrell and Jonas Wendelborn.
With additional contributions from Carlos Miguel Aguiar da Glória, Paolo Alberto Baudino, Federica Bosio, Ties Busschers, Maria Leonor Carrilho Puga, Matilda Gjirja, Maciej Grodzicki, Jaime Hinojosa Laso, Julija Jakovicka, Domenic Kellner, Francesca Lenoci, Riccardo Meli, Daniele Miceli, Philippe Molitor, Cristian Perales, Mara Pirovano, Guido Thomas Maria Pistorius, Chiara Scommegna, Jens Tapking, Pär Torstensson, Marcello Tumino, Christian Weistroffer, Regine Wölfinger, Stefan Wredenborg and Balázs Zsámboki.
© European Central Bank, 2026
Postal address 60640 Frankfurt am Main, Germany
Telephone +49 69 1344 0
Website www.ecb.europa.eu
All rights reserved. Reproduction for educational and non-commercial purposes is permitted provided that the source is acknowledged.
For specific terminology please refer to the ECB glossary (available in English only).
PDF ISSN 1830-2025, QB-01-26-127-EN-N
HTML ISSN 1830-2025, QB-01-26-127-EN-Q
See Le Roux, J. and Spital, T., “Global trade redirection: tracking the role of trade diversion from US tariffs in Chinese export developments”, Economic Bulletin, Issue 1, ECB, 2026.
See El Dahan, M., Mills, A. and Saba, Y., “Exclusive: Iran attacks wipe out 17% of Qatar’s LNG capacity for up to five years, QatarEnergy CEO says”, Reuters, 20 March 2026.
According to the 2026 edition of Eurostat’s Energy in Europe report, the EU’s energy imports dependency rate was 57% in 2024.
For instance, the composite output Purchasing Managers’ Index increased to 51.9 in February 2026, with both the manufacturing output component and services business activity at that level.
See “ECB staff macroeconomic projections for the euro area, March 2026”, published on the ECB’s website on 19 March 2026.
The box builds on Avril, P., Bochmann, P., Fahr, S., Horan, A., Pancaro, C. and Pizzeghello, R., “Risks to euro area financial stability from trade tensions”, Financial Stability Review, ECB, May 2025, and Dieckelmann, D., Kaufmann, C., Larkou, C., McQuade, P., Negri, C., Pancaro, C. and Rößler, D., “Turbulent times: geopolitical risk and its impact on euro area financial stability”, Financial Stability Review, ECB, May 2024. The indicators are described in detail in the ECB/ESRB report “Financial stability risks from global fragmentation”, European Systemic Risk Board, January 2026 and the associated technical annex.
The indicators selected are as follows:
“economic policy uncertainty”, taken from Baker, S.R., Bloom, N., Davis, S.J. and Kost, K.J., “Policy News and Stock Market Volatility”, NBER Working Paper Series, No 25720, 2019; “geopolitical risk”, taken from Caldara, D. and Iacoviello, M., “Measuring Geopolitical Risk”, American Economic Review, Vol. 112, No 4, 2022, pp. 1194-1225; “EMV national security policy and EMV trade policy tracker”, taken from Baker, S.R., Bloom, N., Davis, S.J. and Kost, K.J., “Policy News and Stock Market Volatility”, NBER Working Paper Series, No 25720, 2019; “global supply chain pressure”, taken from Federal Reserve Bank of New York, Global Supply Chain Pressure Index, 2025; “trade policy uncertainty”, taken from Caldara, D., Iacoviello, M., Molligo, P., Prestipino, A. and Raffo, A., “Does Trade Policy Uncertainty Affect Global Economic Activity?”, FEDS Notes, Board of Governors of the Federal Reserve System, 4 September 2019; “common volatility”, taken from Engle, R.F. and Campos-Martins, S., “What are the events that shake our world? Measuring and hedging global COVOL”, Journal of Financial Economics, Vol. 147, Issue 1, pp. 221-242, January 2023; “migration fear”, taken from Bloom, N., Davis, S. and Baker, S., “Immigration fears and policy uncertainty”, VoxEU, Centre for Economic Policy Research, 15 December 2015.The composite indicator builds on a broad set of 12 individual indicators, beyond those represented in Chart A, panel a, and aggregated following the methodology by Holló, D., Kremer, M. and Lo Duca, M., “CISS – A composite indicator of systemic stress in the financial system”, Working Paper Series, No 1426, ECB, March 2012. The indicator also quantifies contributions from the co-movement of individual metrics, representing episodes of a more systemic nature.
See “NextGenerationEU – The road to 2026”, European Commission, 4 June 2025.
See also “Energy measures to attenuate the impact of the current spike in energy prices”, European Commission, 26 March 2026.
Progress has been made on this under the European Commission’s REPowerEU Plan, with additional measures laid out in the Citizens Energy Package. See “REPowerEU – 4 years on”, European Commission, accessed on 19 May 2026, and “Communication on the Citizens Energy Package”, European Commission, 10 March 2026.
See the ECB’s “Survey on the access to finance of enterprises” for the first quarter of 2026.
See the ECB’s “Euro area bank lending survey” for the first quarter of 2026.
The average lending rate between January 2000 and January 2026 was 3.2%, while between January 2005 and January 2026 it was 2.89%.
See Attinasi, M.-G., Boekelmann, L., Geronovics, R. and Meunier, B., “Unveiling the hidden costs of critical dependencies”, Economic Bulletin, Issue 5, ECB, 2025.
See “Households and non-financial corporations in the euro area: fourth quarter of 2025”, Statistical Release, ECB, 9 April 2026.
The composite output Purchasing Managers’ Index increased to 51.9 in February 2026, with both the manufacturing output component and services business activity at that level.
See Dimou, M., Flaccadoro, M. and Gareis, J., “The household saving rate revisited: recent dynamics and underlying drivers”, Economic Bulletin, Issue 8, ECB, 2025.
See Dimou, M., Dossche, M., Hütten, T. and Kocharkov, G., “Consumption and saving amid uncertainty: recent insights from the CES”, Economic Bulletin, Issue 1, ECB, 2026, and De Guindos, L., “Monetary policy and financial stability in the euro area”, speech at the 16th edition of Spain Investors Day, Madrid, 14 January 2026.
See Dias Da Silva, A. and Weißler, M., “AI adoption and employment prospects”, The ECB Blog, ECB, 21 March 2025.
In a recent report, the European Commission’s Joint Research Centre estimated that Europe needed to add 650,000 dwellings per year on top of the 1.6 million already expected to be constructed, in order to meet demographic pressures.
In the third quarter of 2025, the ECB estimate of the deviation from the long-term average of the price/income ratio was positive and increased year on year in Bulgaria, Ireland, Spain, France, Croatia, Latvia, Malta, Netherlands and Portugal.
See also Mosk, B., Pangallo, L. and Zema, S.M., “Cross-asset correlations in a more inflationary environment and challenges for diversification strategies”, Financial Stability Review, ECB, November 2022.
See also Baudino, P.A. et al., “What safe haven after the April US tariff announcement? Implications for euro area financial stability”, Financial Stability Review, ECB, November 2025.
In the March Bank of America global fund manager survey, a record high 63% of respondents said that private equity/private credit would be the most likely source of a credit event and according to the April and May editions, US shadow banking (e.g. private credit) has been considered the most likely source of a systemic credit event.
Data from PitchBook show that around a quarter of euro area corporates that issued high-yield bonds and close to a third of companies that receive leveraged loans also received private credit between 1990 and 2025.
See Böninghausen, B. and Vladu, A.L., “Sloping up: the repricing of euro area yields in 2025”, The ECB Blog, ECB, 16 January 2026.
The main drivers of the improvement in non-interest income were higher net gains on non-trading financial assets (mandatorily at fair value through profit or loss) and other operating income (for which a further breakdown is not available).
Banks are required to report on interest rate risk in the banking book. Based on a sample of 95 euro area significant institutions, 75% of those banks expect that a parallel upward shift of the yield curve by 200 basis points would increase net interest income. However, the rate sensitivity to upward shifts of the yield curve has diminished over time (on average, +7.8 percentage points in the fourth quarter of 2023 compared with +3.7 percentage points in the fourth quarter of 2025).
For an analysis of banks’ exposure to private markets, see Special Feature D in this edition of the Financial Stability Review.
For an assessment of the reasons for low valuations in earlier periods, see Grodzicki, M., Rodriguez d’Acri, C. and Vioto, D., “Recent developments in banks’ price-to-book ratios and their determinants”, Financial Stability Review, ECB, May 2019, and Bochmann, P., Grodzicki, M., Kick, H., Klaus, B. and Pancaro, C., “Euro area bank fundamentals, valuations and cost of equity”, Financial Stability Review, ECB, November 2023.
See also “Financial Integration and Structure in the Euro Area”, ECB, May 2026.
Digital banks, for instance, tend to engage more in cross-border deposit-taking and face higher deposit financing costs. Competition in the deposit market could intensify beyond country borders, should digital banks gain a larger market share. See Garcia, T., Grodzicki, M. and Radulova, P., “Digital banking: how new bank business models are disrupting traditional banks”, Financial Stability Review, ECB, May 2025.
Based on ECB supervisory data, the share of household and non-financial corporation deposits in banks’ non-equity funding stood at 55.3% in the fourth quarters of both 2023 and 2025. Market-based funding grew from 38.8% to 39.7% between 2023 and 2025, making up for a decline in central bank and government funding.
See Grodzicki, M., Klaus, B., Pancaro, C. and Reghezza, A., “Euro area bank deposit costs in a rising interest rate environment”, Financial Stability Review, ECB, May 2023.
See also Pancaro, C., Passantino, V. and Pietsch, A., “The deposit franchise value of euro area banks”, Financial Stability Review, ECB, May 2025.
More than 80% of non-bank repo funding is provided by about 10% of all non-bank lenders and might therefore be difficult to substitute with other repo funding (see “Financial stability risks from linkages between banks and the non-bank financial intermediation sector”, ESRB and ECB, 12 February 2026, and Franceschi, E., Kaufmann, C. and Lenoci, F., “Non-bank financial intermediaries as providers of funding to euro area banks”, Financial Stability Review, ECB, May 2024). Banks could instead seek other funding sources and deploy previously encumbered repo collateral. However, they might also cut repo lending to other banks and non-banks.
See “April 2026 euro area bank lending survey”, press release, ECB, 28 April 2026.
For a detailed analysis of the impact on the euro area banking sector, see Avril, P., Bochmann, P., Fahr, S., Horan, A., Pancaro, C. and Pizzeghello, R., “Risks to euro area financial stability from trade tensions”, Financial Stability Review, ECB, May 2025.
See Supervisory banking statistics, year-to-date figures for the fourth quarter of 2025.
SRTs are instruments that allow banks to transfer the credit risk of specific portfolios to third-party investors without selling the underlying loan portfolio. Risk is shifted through credit-linked notes, derivatives or guarantees, where non-banks are the typical counterparty. As a result, the risk-weight of the loan portfolio is reduced and banks’ capital ratios increase. See also “Synthetic risk transfers”, Basel Committee on Banking Supervision, 17 February 2026.
SRTs are usually fully funded, meaning investors supply high-quality collateral or cash up front to cover the entire credit risk of the protected tranche. As a result, banks are not exposed to counterparty credit risk. However, SRT investors face the potential loss of their entire credit protection amount in the event of a default (see “Synthetic risk transfers”, Basel Committee on Banking Supervision, 17 February 2026).
Balance sheet constraints and the cost of funds have had a broadly neutral impact on credit standards for loans or credit lines to enterprises and households in the last few quarters, with some differences across countries only in late 2025. For more details, see the ECB’s “Euro area bank lending survey” covering the first quarter of 2026.
In December 2025 Croatia announced an increase in its countercyclical buffer rate from 1.5% to 2%, effective on 1 January 2027, to address a rise in cyclical vulnerabilities. During the same month, Malta decided to broaden the scope of its sectoral systemic risk buffer on loans secured by immovable property to cover both natural persons and legal persons, effective June 2026. In March 2026 Bulgaria announced an increase in its countercyclical buffer rate from 2% to 2.25%, effective April 2027, also to address a rise in cyclical vulnerabilities. In April 2026 the Netherlands decided not to extend the Article 458 risk weight measure, which will now expire on 30 November 2026. This decision was taken in light of the gradual decline in systemic risks in the Dutch housing market and expectations that banks will be resilient to housing market risks even without the measure.
As noted in the Governing Council statement on macroprudential policies of 7 July 2025, a targeted recalibration or simplification of macroprudential measures may also be considered when such actions would not substantially reduce the overall resilience of the banking sector.
For more details, see the Governing Council statement on macroprudential policies – the ECB’s framework for assessing capital buffers of other systemically important institutions of 20 December 2024.
The ECB’s 2025 monetary policy strategy statement stressed that resilience and thereby adequate loss-absorbing capacity within the financial system helps avoid potential situations of trade-off between price and financial stability. For more details, see Detken, C., Hempell, H.S. and Pirovano, M., “Macroprudential and monetary policy interaction: the role of early activation of the countercyclical capital buffer”, Macroprudential Bulletin, No 31, ECB, 18 August 2025.
The previous edition of the Financial Stability Review stressed that effective macroprudential policy can help to enhance, rather than jeopardise, the euro area’s competitiveness and productivity in the economy. See “Financial Stability Review”, ECB, November 2025.
See “Eurosystem response to the EU Commission’s targeted consultation on the competitiveness of the EU banking sector”, ECB, April 2026.
Directive (EU) 2024/1619 of the European Parliament and of the Council of 31 May 2024 amending Directive 2013/36/EU as regards supervisory powers, sanctions, third-country branches, and environmental, social and governance risks (OJ L, 2024/1619, 19.6.2024).
The non-releasable buffer would merge the current capital conservation buffer with the buffers for global systemically important institutions and other systemically important institutions, while the releasable buffer would merge the current countercyclical capital buffer with the systemic risk buffer.
For further details, see “Commission seeks input on Basel III market risk rules for banks”, Directorate-General for Financial Stability, Financial Services and Capital Markets Union, European Commission, 6 November 2025.
See “ECB staff contribution to the European Commission’s targeted consultation on the application of the market risk prudential framework”, consultation response, ECB, 15 January 2026.
According to ECB calculations, around 70% of the increase in euro area holdings of US equities between 2015 and 2025 was driven by valuation effects, while the remaining 30% reflect net transactions. Valuation changes stem primarily from price developments, with exchange rate movements playing only a limited role.
Especially severe geopolitical shocks are characterised by an increase of roughly 6 standard deviations in the monthly geopolitical risk index devised by Caldara and Iacoviello. Shocks of such magnitude include the Russian invasion of Ukraine and the outbreak of the war in the Middle East in February 2026 and occur in only 0.8% of monthly observations since 2002. See Caldara, D. and Iacoviello, M., “Measuring Geopolitical Risk”, American Economic Review, Vol. 112, No 4, April 2022, pp. 1194-1225.
The figure is an update of Chart 12a from the 2024 NBFI Risk Monitor kindly provided by the European Systemic Risk Board. Notwithstanding the high share of closed-ended funds, rapid growth in the number of semi-open or open-ended European Long-term Investment Fund vehicles aimed at retail investors could point towards an increased risk of liquidity mismatches in the future.
Payment-in-kind refers to an interest payment in the form of additional debt instead of cash, likely due to cash flow problems on the part of the debtor.
Investment funds investing in lower-rated euro area sovereign debt generally react negatively and more strongly than other financial sectors like banks, insurance corporations or pension funds to increases in financial market uncertainty. See Anaya Longaric, P. et al., “Sovereign bond markets and financial stability: examining the risk to absorption capacity”, Financial Stability Review, ECB, November 2023.
See also Baudino, P.A., Daly, P. and Storz, M., “Examining the dynamics of liquid asset holdings in the non-bank financial sector”, Financial Stability Review, ECB, November 2025.
An insurance rate is the set price per unit of risk or exposure used to calculate an insurance premium.
See EIOPA’s April 2026 IORP Risk Dashboard.
Securities covered include listed shares, short-term and long-term debt securities as well as money market and non-money market investment fund shares/units. Euro area insurance corporations and pension funds held a total of €5.9 trillion and €2.6 trillion of these instruments respectively. For these purposes, the Middle East comprises Algeria, Bahrain, Djibouti, Egypt, Iran, Iraq, Jordan, Kuwait, Lebanon, Libya, Mauritania, Morocco, Oman, Qatar, Saudi Arabia, Somalia, Sudan, Syria, Tunisia, United Arab Emirates, West Bank and Gaza, and Yemen.
According to Section 3 of EIOPA’s Financial Stability Report December 2025, insurance corporations held 5.8% of their total assets in private credit (either directly or through funds) in the second quarter of 2025, a notable increase from the 3.9% recorded in 2016. Similarly, pension funds reported private credit exposure of 4.4% in 2024, up from 3.3% in 2020. EIOPA’s methodology relies on non-publicly available Solvency II data to identify the exposures that are most representative of illiquid and opaque assets. It is important to note that EIOPA’s reporting covers the EEA, while the data shown in this review (Chart 4.7, panel b) are limited to the euro area.
The EU Commission has provided guidance to MMF managers and competent authorities that MMFs should hold levels of weekly liquid assets that are well above the minimum requirements so as to ensure market resilience. The Commission has not proposed to increase minimum requirements at this stage. See “Report From The Commission To The European Parliament And The Council on the adequacy of Regulation (EU) 2017/1131 of the European Parliament and of the Council on money market funds from a prudential and economic point of view”, 11 May 2026.
See the “Statement by the ECB Governing Council on advancing the Capital Markets Union”, 7 March 2024.
For a more extensive overview of the proposals, see “Strengthening the macroprudential lens in the regulation of non-bank financial intermediation”, FSC high level task force on NBFI, ECB, May 2026.
Directive 2009/65/EC of the European Parliament and of the Council of 13 July 2009 on the coordination of laws, regulations and administrative provisions relating to undertakings for collective investment in transferable securities (UCITS) (OJ L 302, 17.11.2009, p. 32).
Directive 2011/61/EU of the European Parliament and of the Council of 8 June 2011 on Alternative Investment Fund Managers and amending Directives 2003/41/EC and 2009/65/EC and Regulations (EC) No 1060/2009 and (EU) No 1095/2010 (OJ L 174, 1.7.2011, p. 1).
See “Strengthening the macroprudential lens in the regulation of non-bank financial intermediation”, FSC high level task force on NBFI, ECB, May 2026.
See also “Discussion paper on the integrated collection of funds’ data”, ESMA, 23 June 2025.
For example, the regulation governing ELTIF funds can allow for open-ended structures of private credit and real estate funds.
See Falato, A., Goldstein, I. and Hortaçsu, A., “Financial fragility in the COVID-19 crisis: The case of investment funds in corporate bond markets”, Journal of Monetary Economics, Vol. 123, October 2021, pp. 35-52, and “Policy Recommendations to Address Structural Vulnerabilities from Asset Management Activities”, Financial Stability Board, 12 January 2017.
See “Report: Recommendation of the European Systemic Risk Board (ESRB) on liquidity risk in investment funds”, European Securities and Markets Authority, 12 November 2020.
See Mundell, R.A. “The appropriate use of monetary and fiscal policy for internal and external stability”, IMF Staff Papers, Vol. 9, No 1, International Monetary Fund, 1962, pp. 70-79.
We are thankful to Maria Leonor Carrilho Puga for assistance with data work.
-
27 May 2026