



The drivers of the 2025 surge in euro area banks’ market valuations
Published as part of the Financial Stability Review, May 2026.
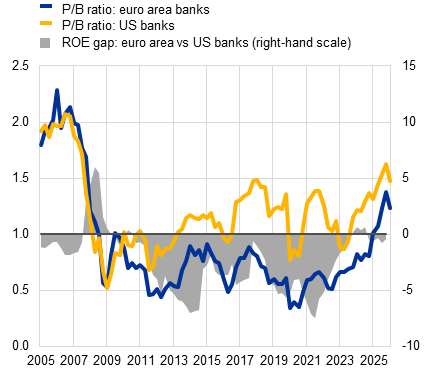
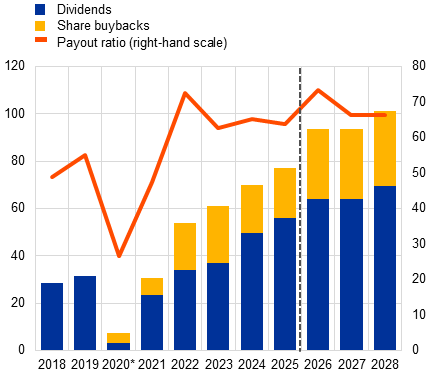
The market valuations of euro area banks rose sharply between the start of 2025 and early 2026 to reach levels last seen before the global financial crisis. Following more than a decade of persistently depressed valuations and low profitability,[1] euro area banks’ price-to-book (P/B) ratios have been on an upward curve since late 2022, with the most significant increase seen during 2025. Euro area banks have converged with their US peers in terms of profitability, and consequently the gap between euro area and US bank valuations has narrowed significantly (Chart A, panel a). By February 2026, the euro area aggregate P/B ratio had reached a level not seen since before the global financial crisis, although it then receded, mainly due to the outbreak of war in the Middle East. In the period up to February 2026, increased shareholder payouts and an expectation that high payouts would continue for the next couple of years, along with a rising proportion of share buybacks, may have also helped to make euro area bank shares more attractive for investors (Chart A, panel b).
Chart A
The marked increase in euro area bank valuations up to early 2026 was aided by a sustained improvement in profitability and increased payouts to shareholders
a) Banks’ P/B ratios in the euro area and the United States, and the ROE gap between euro area and US banks | b) Capital returned to shareholders by listed euro area banks |
|---|---|
(Q1 2005-Q1 2026; multiples, percentage points) | (2018-25, estimates for 2026-28; € billions, percentages) |
 |  |
Sources: Bloomberg Finance L.P. and ECB calculations.
Notes: Panel a: the price-to-book (P/B) ratio and return on equity (ROE) are based on banks in the EURO STOXX Banks index for the euro area and the KBW Nasdaq Bank index for the United States. Panel b: based on a sample of 28 banks (members of the EURO STOXX Banks index). The payout ratio is calculated as total return to shareholders divided by adjusted net income. Total return to shareholders is the sum of dividends paid and the value of share buybacks. The payout ratio is weighted by adjusted net income at bank level. *Payouts for the 2020 financial year were affected by the ECB recommendation that, until at least 1 October 2020, banks should not pay out dividends and should refrain from share buybacks aimed at remunerating shareholders.
The 2025 surge in banks’ P/B ratios has raised questions about the sustainability of high valuations going forward and the risks for financial stability. While high market valuations for banks may reflect strong earnings power, they could also signal investor over-optimism and compressed equity risk premia. If the expectations for economic growth or banks’ return on equity are not met, risk premia could be abruptly reassessed. Banks would not need to raise equity as long as they were not confronted by large losses. Nonetheless, a marked fall in equity valuations could weigh on investor confidence and, through increasing the cost of equity, could also influence banks’ lending behaviour.
This box summarises an empirical investigation into the main drivers behind the marked increase in euro area bank valuations and the factors explaining the remaining gap with US banks. Specifically, the box decomposes euro area and US banks’ P/B ratios into macroeconomic, bank-specific and market determinants,[2] drawn from the literature on the drivers of banks’ price/book ratios.[3] The breakdown is carried out using a Vector Error Correction Model (VECM). VECMs are run for the euro area and US aggregate P/B ratios, with the estimation period spanning from the first quarter of 2005 to the fourth quarter of 2025. The signs and magnitudes of the estimated coefficients are in line with those cited in the literature.[4]
Chart B
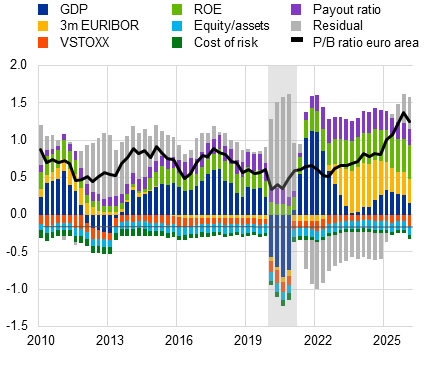
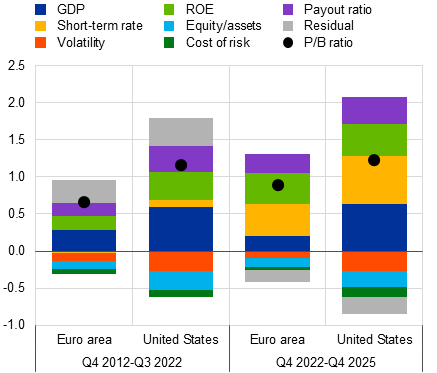
Higher bank profitability, payout ratios and short-term rates have all helped to boost euro area bank valuations, with weaker economic growth explaining most of the gap to US banks
a) P/B ratio decomposition for euro area banks | b) P/B ratio decomposition for euro area and US banks, for selected periods |
|---|---|
(Q1 2010-Q1 2026, multiples) | (Q4 2012-Q4 2025, multiples) |
 |  |
Sources: Bloomberg Finance L.P., Haver Analytics, ECB and ECB calculations.
Notes: Panel a: the sample comprises 27 euro area banks. The shaded area indicates the period of the COVID-19 pandemic. Panel b: the sample comprises 27 euro area banks and 23 US banks. Average contributions by factor.
Higher short-term interest rates, bank profitability and payout ratios were the most significant factors contributing to increased euro area bank valuations between 2022 and 2025. Having made a contained, or even slightly negative, contribution for the period from 2010 to 2021, short-term interest rates have since accounted for a sizeable part of the rise in euro area banks’ P/B ratios. This was particularly the case during the rate hiking cycle that ran from July 2022 to June 2024 and is consistent with the fact that exiting the low interest rate environment pushed the value of banks’ deposit franchises back into positive territory.[5] Similarly, between 2022 and 2025, improvements in banks’ fundamentals (profitability) and payout ratios (including both dividends and share buybacks) made a significant positive contribution to higher bank P/B ratios (Chart B, panel a). Stronger and more sustainable profitability helps banks to accumulate capital, thereby increasing their capacity to make larger shareholder payouts and reduce their equity risk premia. The residual, which was negative during the post-pandemic period, was close to zero in the middle of 2025 and even turned positive in the third quarter of 2025.[6] This suggests that banks’ actual P/B ratios are broadly consistent with their estimated fundamental values, given the assumed long-term relationship between bank valuations and their determinants. Estimates for the first quarter of 2026 suggest that a worsening macroeconomic environment and greater financial market volatility following the outbreak of war in the Middle East had a negative impact on bank valuations.
The persistently lower valuations of euro area banks compared with their US peers mainly reflect differences in macroeconomic conditions rather than bank fundamentals. Estimated results confirm that, on average, the narrowing of the euro area-US bank valuation gap since the fourth quarter of 2022 has been driven mainly by improvements in the profitability of euro area banks. The remaining gap seen since late 2022, can for the most part, be attributed to weaker macroeconomic conditions and, to a lesser extent, continuing lower payout ratios (Chart B, panel b).
Based on the estimated models, euro area banks’ P/B ratios appear to be broadly in line with past regularities overall but remain vulnerable to negative surprises. The surge in P/B ratios during 2025 could be interpreted as the market value of euro area bank shares being raised from depressed levels as equity investors gradually acknowledged the impact of a positive interest rate environment and a sustained improvement in bank profitability. However, the recent increase in geopolitical uncertainties and the worsening of the macroeconomic outlook could have negative implications for banks’ earnings outlooks and equity risk premia. Bank valuation trends should therefore be monitored to detect possible signs of overconfidence.
For an assessment of the reasons for low valuations in earlier periods, see Grodzicki, M., Rodriguez d’Acri, C. and Vioto, D., “Recent developments in banks’ price-to-book ratios and their determinants”, Financial Stability Review, ECB, May 2019, and Bochmann, P., Grodzicki, M., Kick, H., Klaus, B. and Pancaro, C., “Euro area bank fundamentals, valuations and cost of equity”, Financial Stability Review, ECB, November 2023.
Macroeconomic variables include real GDP growth and short-term interest rates (three-month EURIBOR and three-month Treasury bills), while bank-specific fundamentals include measures of profitability (return on equity), capitalisation (equity/total assets), asset quality (cost of risk, defined as provisions divided by total loans) and payout ratios (defined as the sum of dividends and share buybacks divided by adjusted net income). Finally, market volatility is accounted for by including the VSTOXX and VIX indices.
See, for example, Calomiris, C.W. and Nissim, D., “Crisis-related shifts in the market valuation of banking activities”, Journal of Financial Intermediation, Vol. 23, Issue 3, July 2014, pp. 400-435; Bogdanova, B., Fender, I. and Takáts, E., “The ABCs of bank PBRs”, BIS Quarterly Review, Bank for International Settlements, March 2018; and Grodzicki, M., Rodriguez d’Acri, C. and Vioto, D., “Recent developments in banks’ price-to-book ratios and their determinants”, Financial Stability Review, ECB, May 2019.
The VECM’s explanatory power is also in line with the literature, as the model explains around 50% of the total forward error variance in P/B ratios.
See Pancaro, C., Passantino, V. and Pietsch, A., “The deposit franchise value of euro area banks”, Financial Stability Review, ECB, May 2025.
The residuals mainly capture unexplained temporary shocks (e.g. temporary shifts in investor sentiment) which are not explained by the long-run cointegrating relationship. It should be noted that payout ratios, which are cash flow-based, may be understated for the third and fourth quarters of 2025. The residual in these periods should therefore be treated with caution.