


Developments in the recent euro area house price cycle
1 Introduction
Developments in house prices play an important role in the economic and monetary analyses conducted by central banks. Notably, they are indicative of the strength of monetary policy transmission and of household balance sheet positions. Residential property prices, in conjunction with financing conditions, affect the affordability of housing and this can have knock-on effects for, among other things, construction activity and the rental market. This article reviews developments in the recent house price cycle in the euro area to better understand the possible implications for the economy.
House price cycles typically follow a boom-bust pattern but can display marked differences in their underlying triggers and drivers. Assessing house price cycles in relation to business cycles only offers a partial perspective. While there is a fair degree of coherence between residential property price and real GDP cycles (Chart 1), the former tends to be longer and have a larger amplitude. Higher volatility associated with boom-bust patterns suggests a larger role for expectations (including speculation) in house price cycles in addition to fundamentals such as income and demand that govern both residential property price and real GDP cycles.[1] Moreover, the degree of synchronicity across countries is lower for house price cycles than real GDP cycles, suggesting that a euro area house price cycle can reflect many country-specific influences.[2] Therefore, this article focuses on stylised facts and broad drivers of house price cycles that are visible at the euro area-wide level.
Chart 1
Real GDP, nominal and real house prices in the euro area
(annual percentage changes)
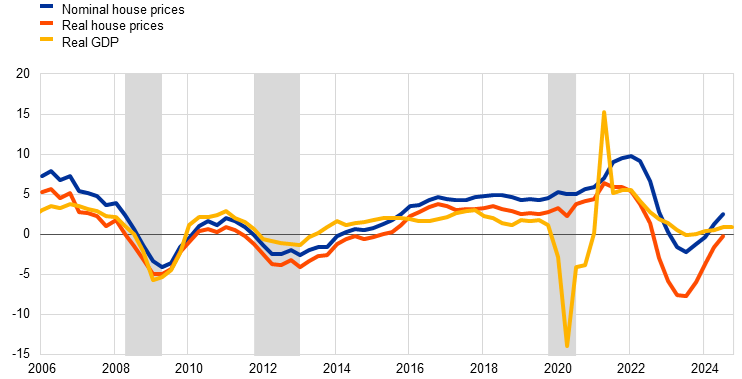
Sources: Eurostat, ECB and ECB staff calculations.
Notes: Grey areas delimit recessions, as identified by the Centre for Economic Policy Research Euro Area Business Cycle Dating Committee. Real house prices are nominal house prices deflated by the GDP deflator. The latest observations are for the third quarter of 2024 for nominal and real house prices and for the fourth quarter of 2024 for real GDP.
2 Recent house price dynamics compared with previous house price cycles
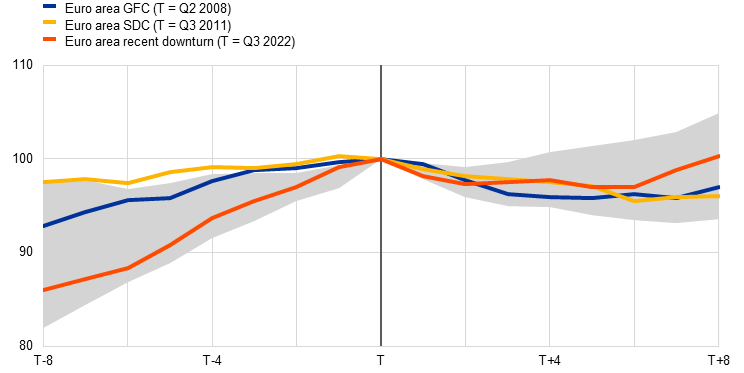
The recent downturn in euro area house prices was relatively mild and short-lived. Data for the third quarter of 2024 suggest that the house price cycle has safely moved past its trough and the level of house prices has already recovered to that of the previous peak observed in the third quarter of 2022. This recovery has been much faster than those following the global financial crisis (GFC) and the sovereign debt crisis (SDC) (Chart 2, panel a). In retrospect, the peak-to-trough part of the cycle saw a cumulative decline of 3% over one and a half years, which was shallower and shorter than the almost 5% cumulative decline recorded over two years during the GFC and the SDC.[3] The relatively limited “bust” in house prices stands out compared with previous cycles, as the run-up to the peak in 2022 had been accompanied by estimated residential property price valuations relative to fundamentals that exceeded those observed at the peaks during the GFC and the SDC (Chart 2, panel b).[4]
Chart 2
Comparison of nominal house price developments and valuations around peaks
a) Nominal house price developments
(index, peak (T) = 100)
b) Valuations around peaks
(percentages of over- and undervaluation)

Sources: ECB, Eurostat and ECB staff calculations.
Notes: The shaded area denotes the interquartile range of house price developments around peaks for all individual euro area countries and the aggregate. The identification of house price cycles is based on the Bry-Boschan algorithm with a minimum length of five quarters per cycle and two quarters for up- and downturns. Note that the build-up phase before the peak of the sovereign debt crisis (SDC) is also the post-peak phase of the global financial crisis (GFC). For Panel b), the lines refer to the average of the estimates based on four different valuation methods, as regularly reported in Chart 3.12 of the ESRB risk dashboard. The latest observations are for the third quarter of 2024.
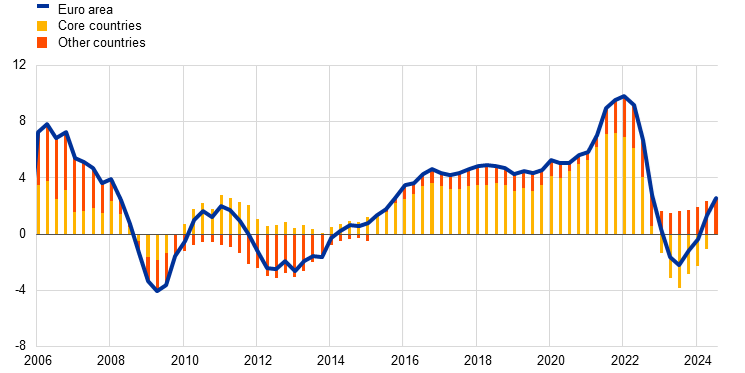
Disaggregation of euro area house price growth into different characteristics can provide additional insight into the features of the recent house price cycle. While euro area-wide house price dynamics during the GFC and the SDC were largely explained by what, at the time, was called “periphery” countries, recent dynamics were much more strongly driven by “core” countries (Chart 3), and in particular by Germany with its high weight in aggregate house prices. With only 12 of the euro area countries experiencing a decline in prices, the latest cycle was less pervasive than that during the GFC where all but one country experienced a downturn. The change in country composition of euro area-wide dynamics could point to a rotation of boom-busts in combination with an overall broad trend of rising house prices. For some countries, the shift to a more favourable interest rate environment after the introduction of the euro led to a boom-bust cycle that took quite some time to clean up and recover from (as in the case of Spain). During the low interest rate period following the GFC and the SDC, it was mainly other, previously less affected countries that saw their housing markets react to favourable financing conditions, with them eventually seeing a correction of exuberant price dynamics (as in the case of Germany).
Chart 3
Contributions to euro area house price growth by subgroups of countries
(annual percentage changes, percentage point contributions)
Sources: Eurostat, ECB and ECB staff calculations.
Notes: Eurostat’s series for individual countries have different starting dates. Previous to that starting date, the series are backcasted based on growth rates from an ECB series. The bars represent percentage point contributions to the euro area growth rate based on GDP weights. Germany, France, the Netherlands, Austria, Belgium, Luxembourg and Finland are classified as belonging to the group of “core” countries, those countries classified under “Other countries” broadly speaking saw a more pronounced house price cycle during the GFC and the SDC. The latest observations are for the third quarter of 2024.
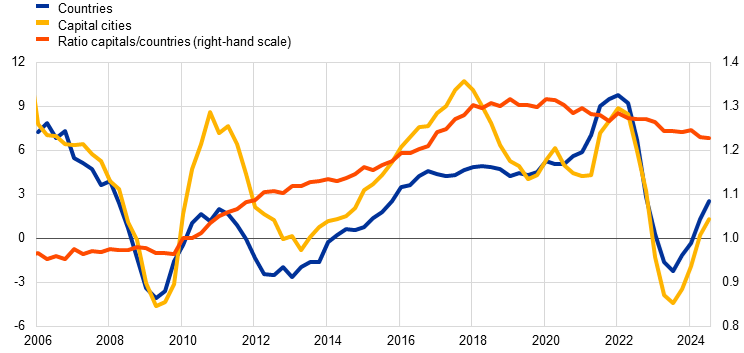
The recent house price cycle saw more balanced developments between house prices in capital cities and the average house price in their respective countries. Up until the pandemic, house prices in capital cities had a history of growing more strongly than in their respective countries as a whole. At the same time, there was more acceleration and deceleration in the house price dynamics of capital cities (Chart 4). These differences are consistent with the notion that “location” is a key element in house prices and that dynamics are more buoyant in supply constrained markets. A larger share of affluent buyers and a perception of reliable resale values in good locations such as capitals can amplify price movements driven by fundamentals, expectations or speculation as compared with other locations. At the end of 2019, house prices in capital cities were 71% higher than during the pre-GFC period in early 2006, as compared with 28% for the euro area aggregate. The most recent house price cycle has somewhat realigned these relative dynamics, with house prices in euro area capital cities witnessing slower price dynamics than the euro area country average. This could reflect the already high and possibly less affordable price levels in capital cities but, more likely, also the specific and reinforcing impact of the pandemic and its implications for remote working that allowed workers to live further away from their offices and in less expensive locations.[5]
Chart 4
Nominal residential property prices for the euro area and a synthetic euro area aggregate of capital cities
(annual percentage changes, ratio 2010 Q1 = 1)
Sources: ECB, Eurostat, Bank for International Settlements and national sources, ECB staff calculations.
Notes: The country average refers to Eurostat’s euro area series. The euro area synthetic aggregate series for capital cities is a weighted average based on GDP weights. The aggregate includes Belgium, Germany, Estonia, Ireland, Spain, France, Italy, the Netherlands, Austria Slovenia and Finland. The latest observations are for the third quarter of 2024.
House price dynamics in the recent cycle reflected particularly buoyant developments in the prices of existing dwellings. These dwellings account for the bulk of housing transactions and their prices therefore typically define the shape of the overall house price cycle. At the peak of the cycle, the annual growth rate of prices for existing dwellings was half a percentage point higher than that of new dwellings and at the trough it was around 6 percentage points lower, a larger difference than that which had been observed in the GFC and – in particular – the SDC cycles (Chart 5). This likely reflects the long duration of the housing market upturn that may, towards its end, have increasingly been facing supply constraints for new dwellings, making buyers increasingly turn to existing properties. This was then reinforced during the pandemic when construction activity slumped and, at the same time, buyers were looking for dwellings that implied an upgrade in terms of square meters which could be situated in locations with hitherto lower price levels.[6] Once the exuberance element in buying existing dwellings had faded and energy costs became a more relevant element in the type of preferred housing, prices for existing dwellings dwindled much faster than those for new dwellings. The latter’s unwinding was also more constrained, as there were limits to lowering prices in view of the high construction costs under which new dwellings had been built in recent years.
Chart 5
Euro area residential property prices by types of dwelling
(annual percentage changes)
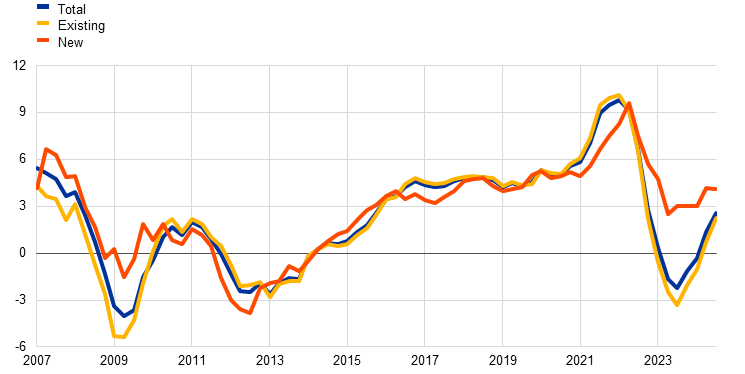
Sources: ECB, Eurostat and ECB staff calculations.
Notes: Eurostat’s euro area series for new and existing dwellings only starts in the fourth quarter of 2009. Data for the period prior to this are based on backcasting with growth rates from a GDP-weighted country aggregation, including Germany, France, Spain, the Netherlands, Belgium, Estonia, Greece, Croatia, Latvia, and Lithuania. The latest observations are for the third quarter of 2024.
The stylised facts indicate that the recent house price cycle was different from those during the GFC and the SDC. The price boom appears to have been broader based across categories and may reflect the fact that increases had also extended to less central locations or to less modern dwellings, particularly in relation to pandemic-related shifts in preferences. This implies that the boom may have come with less financial stretching and exposure of buyers than at other times and that this helped to contain the subsequent bust (Section 3). Ultimately, the price correction unwound the additional surge in prices in the aftermath of the pandemic but left the sustained increases recorded in pre-pandemic years in these price levels. The busts during the GFC and SDC cycles had implied relatively more erosion of previous multi-year price gains.
3 Key factors shaping the recent house price cycle
Model-based analysis suggests that, generally speaking, the largest driver in boom-bust house price cycles is the demand factor. The model used in Box 1 identifies housing-specific demand shocks as the main drivers of the house price downturns during the GFC and SDC cycles, but not during the latest downturn. Instead, aggregate supply shocks related to energy price shocks and pandemic-related supply disruptions had a relatively larger impact. Contrary to past cycles, the model also sees monetary policy more noticeably contributing to the recent downturn than the past declines in house prices. This is consistent with the profound change from a long period of low mortgage interest rates to a period of steep tightening of financing conditions and possible non-linear effects emanating from such a change.[7] Decompositions of house price developments into originating shocks can be a starting point for an assessment of driving factors but they are naturally model-specific, depending on the selection of variables and shocks and how these shocks are identified. Assessing house price cycles therefore also benefits from a model-free discussion of pertinent groups of factors and indicators.[8]
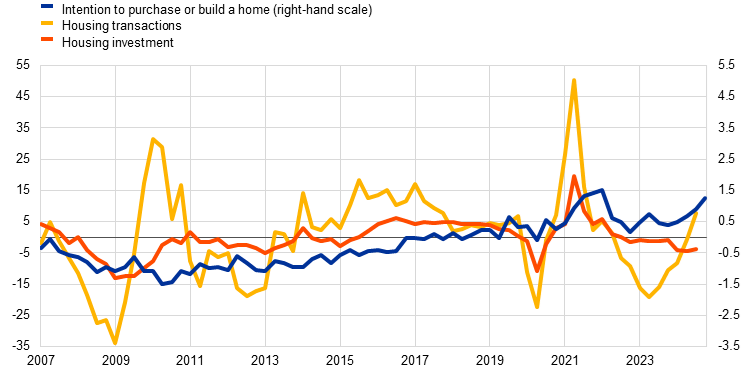
Demand factors go some way towards explaining the recent house price cycle. Looking beyond the short-lived constraints in activity during the lockdown of the pandemic period, growth in housing investment and transactions point to a period of sustained strong housing demand in the run-up to the recent house price boom (Chart 6, panel a). This is also reflected in the continued rise of intentions to purchase or build a home to levels not seen since the introduction of the euro. Indeed, the pandemic period appears to have ultimately coincided with an additional boost in demand, likely related to housing relocations in times of an increased preference for remote working.[9] This is in line with a large shock in preferences that some models identify for the pandemic period as compared with what had been observed in previous house price cycles.[10] The subsequent fall in housing demand effectively unwound the exceptional pandemic surge in demand and was relatively limited. Housing investment and transactions declined but show signs of having bottomed out, and intentions to purchase a home have only seen a temporary dent at continued high levels (Chart 6, panel a). This provides the basis for the observed, relatively fast recovery in house prices.
Chart 6
Euro area indicators relevant for housing demand
a) Housing-specific indicators
(standardised percentage balances, annual percentage changes)
b) Aggregate demand indicators
(index 2005 Q1 = 1, annual percentage changes, percentage of gross disposable income)
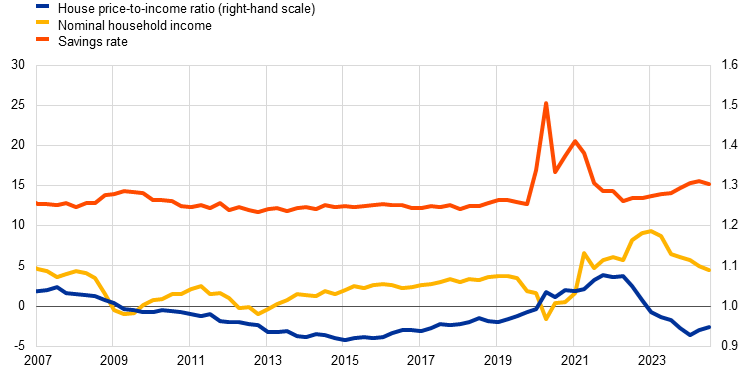
Sources: European Commission, Eurostat, ECB, Agenzia Entrate and ECB staff calculations.
Notes: Standardisation of intentions to buy implies a zero mean and unit standard deviation from the first quarter of 1999 to 2019. Housing transactions are an aggregation of Eurostat’s available data and information from national sources for euro area countries that together account for around 70% of euro area GDP. This coverage declines for years before 2015. The latest observations are for the third quarter of 2024, except for the fourth quarter of 2024 for intentions to buy a home.
Robust growth in disposable income supported housing demand and the debt servicing capacity of euro area households. Unlike in the GFC and SDC downturns, labour market conditions generally remained favourable during the recent house price cycle. Together with income support measures by governments during the pandemic and energy crises, this allowed household income to increase more than mortgage costs and contained the increase in the house price-to-income ratio during the house price boom (Chart 6, panel b). Households could afford higher mortgage payments and the savings accumulated during the pandemic also put them in a position to make larger downpayments. The financial burden for homeowners with a mortgage remained overall relatively low compared both with that for owners without a mortgage or that for tenants paying rents, as well as with what was the relative burden in earlier house price cycles.[11] In contrast to the GFC and SDC cycles, the recent downturn in house prices coincided with robust income developments and the decline in the house price-to-income ratio therefore implied an improvement in affordability that has underpinned the current recovery of house prices despite less favourable financing conditions than at the start of the house price cycle.
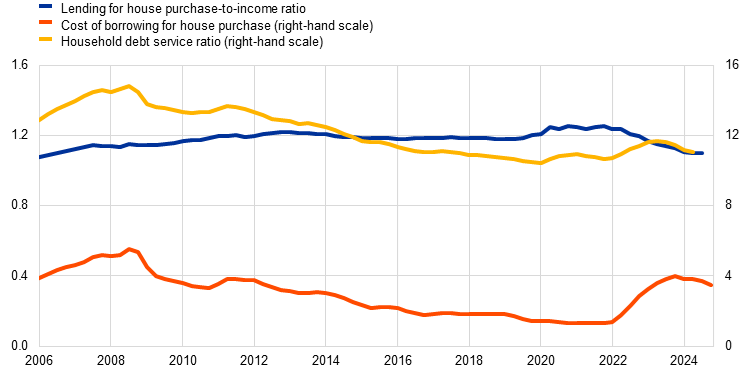
The role of tighter financing conditions in the adjustment of house prices was mitigated by relatively sound balance sheet positions. The sharp increase in interest rates in response to the 2022 surge in inflation coincided with still substantially overvalued house prices.[12] This could have been expected to lead to a much stronger bust in prices than was ultimately observed. One reason for differences with corresponding adjustments in the GFC and SDC cycles was that these overvaluations coincided with sounder household and bank balance sheet positions than had been the case at the time of the previous two cycles. Much lower mortgage credit growth and a lower debt service ratio compared with the pre-GFC period, which was partly due to the more widespread use of macroprudential policy, also implied more resilient household balance sheets and less risk of a disorderly unwinding of the house price boom, and consequently less volatility in the house price cycle (Chart 7).[13] Moreover, many euro area countries had moved in the direction of a stronger prevalence of fixed rate mortgages, which temporarily protect homeowners from higher borrowing rates and imply lower default rates that could exacerbate house price busts. At the same time, this suggests that, for many households, nominal mortgage payments are likely to increase once their current fixed rate contracts expire and are replaced by those with meanwhile higher interest rates.[14] The recent normalisation of interest rates limits this risk, as it kept the period during which households had to renegotiate their contracts at higher rates rather short. It also ends a short period in which the return on housing as an asset had become less attractive than the return on fixed income investments, which had therefore dampened the demand for housing.[15]
Chart 7
Euro area household borrowing and debt servicing conditions
a) Household borrowing conditions
(index 2005 Q1 = 1, annual percentage changes)
b) Lending for house purchase and house prices
(annual percentage changes)
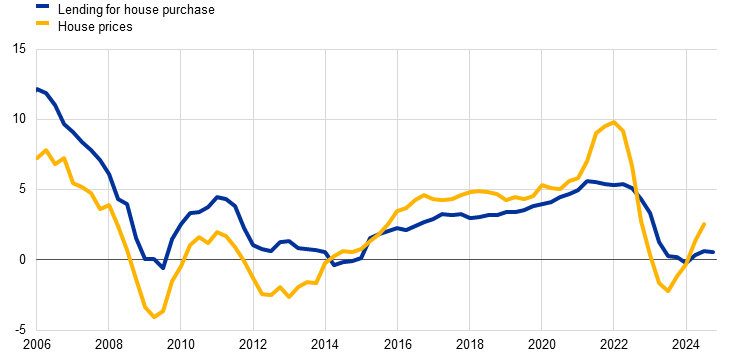
Sources: Eurostat, ECB (MIR) and ECB staff calculations.
Notes: The lending for house purchase-to-income ratio is the lending for house purchase divided by households’ disposable income based on the aggregate macroeconomic series. This ratio is different to that of lending standards, which is calculated at loan level at origination. The debt service ratio is defined as the ratio of fixed debt service costs (i.e. interest payments plus amortisations) to disposable income, as reported in the ECB Financial Stability Review in May 2024. The latest observations are for the third quarter of 2024, except for the fourth quarter of 2024 which is for the cost of borrowing and for the lending for house purchase.
The impact of monetary policy tightening on house prices also depends on the link between the housing market and the rental market. If higher interest rates imminently dampen affordability and therefore house purchases, households can be expected to turn more strongly to the rental market to satisfy their demand for shelter.[16] This should put downward pressure on house prices and upward pressure on rental prices (Box 2 discusses the relation between house prices and rental prices). However, the elasticity of households to shift between owning and renting depends on both the general level of rental prices and the availability of let property. In this respect, the tightening of financing conditions has also affected the attractiveness of investing in buy-to-let property and ultimately the supply in the rental market. This holds true even more if prices in the rental market are subject to regulation or if the availability in the rental market is subject to shocks such as immigration.
The impact of housing demand and monetary policy factors on house prices also depends on the state of the housing supply. In this respect, the model in Box 1 points to a relatively large role played by supply shocks in the recent house price downturn. This relates to both housing-specific and aggregate supply factors. Building permits, as a proxy for new housing supply, increased since the SDC cycle but remained at substantially lower levels than during the GFC cycle. In the recent house price downturn, they declined sharply reaching historical lows (Chart 8, panel a). This indicates that supply-side shortages prevail, and this helps to explain the relatively short-lived unwinding of house prices and their latest upturn as soon as improved financing conditions started to underpin demand. Economy-wide factors related to supply chain and energy price shocks also affected the construction sector and the supply of housing. Construction costs had risen sharply during the pandemic and post-pandemic periods related to both materials and labour shortages (Chart 8, panel b). This put upward pressure on house prices primarily via house prices for new buildings but also via those for existing buildings where the transaction was conditional upon prior renovation and maintenance. This has, for instance, been the case for measures that increase the energy efficiency of older buildings. The costs of such measures and the corresponding hesitance of potential buyers also help explain why prices for existing dwellings slumped much more than those for new dwellings.
Chart 8
Euro area indicators relevant for housing supply
a) Housing-specific indicators
(index, 2008 Q1 = 100)
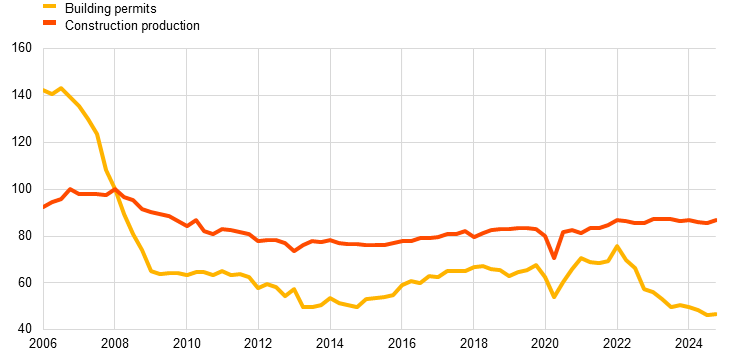
b) Aggregate supply indicators
(percentages, annual percentage changes)
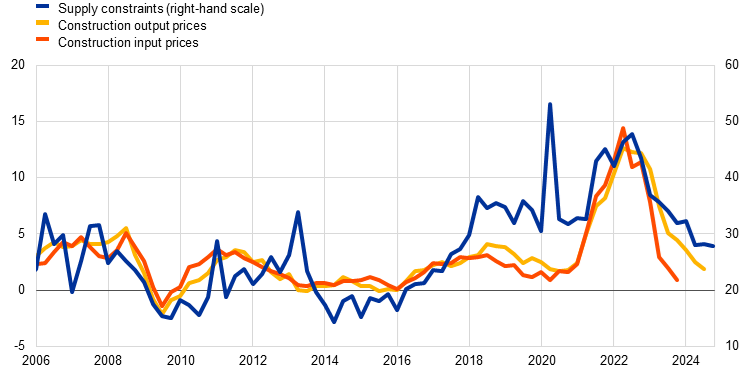
Sources: Eurostat and ECB staff calculations.
Notes: For panel b), the series for construction input prices is only available until the fourth quarter of 2023. The latest observations are for the third quarter of 2024 for construction output prices and the fourth quarter of 2024 for building permits, construction production and supply constraints compiled on the basis of the European Commission’s business survey for the construction sector.
Evidence from models and pertinent indicators corroborates the notion that the recent house price cycle exhibited some special features. This relates particularly to the strong upward demand shocks and their likely overlap with a strong preference shock during the house price boom. The pure unwinding of these shocks can explain a substantive part of the subsequent house price bust. The tightening of monetary policy and bank lending standards contributed to the turn of the cycle, despite resilient income fundamentals and constraints in the supply of housing.
Box 1
The fundamental drivers of euro area house prices
This box provides an empirical assessment of the fundamental drivers of house price developments in the euro area. To this end, it uses a structural Bayesian vector autoregression (SBVAR) model that includes real private consumption, the private consumption deflator, real housing investment, nominal house prices, the short-term risk-free interest rate, and the long-term interest rate spread.[17] The model imposes sign and zero restrictions on the responses of the model variables to various shocks.[18] In addition to aggregate demand and supply shocks, the model considers housing-specific demand and supply shocks, as well as a risk-free rate shock and a term spread shock. The latter two shocks refer to unexpected changes in the risk-free rate and the term spread beyond their systematic reaction to economic fluctuations. Hence, risk-free rate and term spread shocks capture conventional and unconventional monetary policy shocks, commonly interpreted as shocks affecting short-term risk-free rates and the slope of the yield curve, respectively.[19] In the context of the recent monetary policy tightening, these shocks broadly reflect the reversal of the ECB’s loose monetary policy stance beyond historical regularities, through a steepening of the yield curve and a sequence of hikes in short-term rates to counter the exceptional rise in inflation. The model is estimated based on data between the first quarter of 1995 and the third quarter of 2024.[20]
To gain insight from a historical perspective, the model-based impact of fundamental drivers of euro area house prices is compared across upturns and downturns from different periods in the past, namely the global financial crisis and the sovereign debt crisis, as well as in the period from the recent monetary policy tightening up to the latest available quarter (Chart A). Considering these past periods, housing demand shocks always dominated downturns in house prices. Indeed, housing demand shocks played the largest role in the fall in house prices during the global financial crisis and the sovereign debt crisis, largely mirroring their crucial role in the build-up of house prices before the global financial crisis. Among the other shocks, contractionary housing supply shocks led to higher house prices during the upturns of both of these periods, while contractionary aggregate supply shocks weighed on house prices during the downturns of both of these periods, highlighting the detrimental wealth effects of cost-push inflation for households. Moreover, term spread shocks moderately supported house prices throughout the various phases of the past periods. Instead, risk-free rate shocks exerted a limited impact on house price fluctuations during the past periods under review.
Chart A
The impact of fundamental drivers on euro area house prices during different periods
(average quarterly changes during the considered periods, percentages and percentage points, deviations from trend)
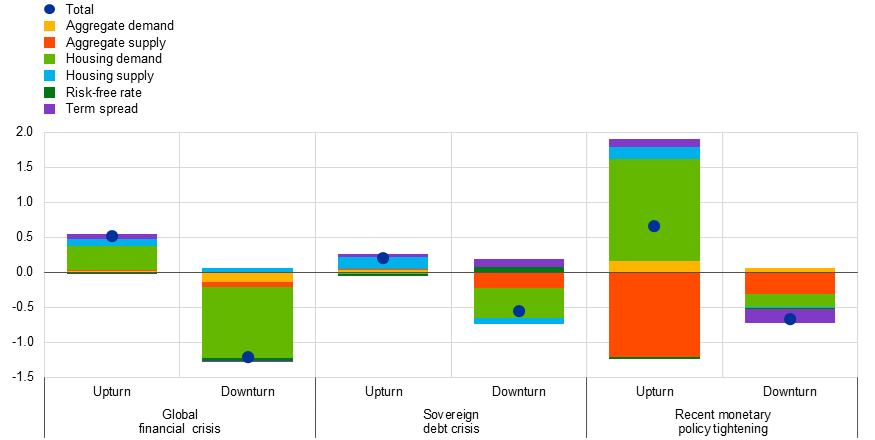
Sources: Eurostat, ECB, and ECB staff calculations.
Notes: The chart shows the average quarterly impact of identified shocks derived from a SBVAR model with sign and zero restrictions on house prices over the periods under review. The global financial crisis includes the period from the first quarter of 2004 to the second quarter of 2008 for the upturn and the period from the second quarter of 2008 to the second quarter of 2009 for the downturn, the sovereign debt crisis from the second quarter of 2009 to the third quarter of 2011 for the upturn and from the third quarter of 2011 to the first quarter of 2013 for the downturn, and the recent monetary policy tightening from the first quarter of 2020 to the fourth quarter of 2021 for the upturn and from the fourth quarter of 2021 to the third quarter of 2024 for the downturn.
Turning to the recent monetary policy tightening, according to the model results, the decline in house prices was broadly in line with the previous downturns during the global financial and the sovereign debt crises in terms of average quarterly size. Yet, it was substantially different in nature, reflecting a different combination of fundamental drivers. First, compared with the previous two crises, aggregate supply shocks played a larger role. This likely reflected the lasting effects of the energy price shock resulting from Russia’s war against Ukraine, which extended and exacerbated the pandemic-related supply disruptions and pushed up inflation to exceptionally high levels, dampening general economic and housing market activity. Moreover, housing demand shocks also exerted a negative impact, but their effect was smaller as compared with the previous two crisis periods, likely reflecting the prolonged impact of the significant shift in household preferences towards residential (rather than other types of) real estate during the COVID-19 pandemic, induced by the mandatory and voluntary restrictions on mobility, the diffusion of remote working and the accumulation of excess savings.[21] Finally, while risk-free rate shocks played a limited role in the recent decline in house prices, as was also the case in previous periods, term spread shocks significantly dampened house price growth in contrast to previous periods. These results are consistent with the timing of the ECB’s recent monetary policy tightening, with the ECB first announcing the exit from unconventional monetary policy at the end of 2021, before raising monetary policy rates as of mid-2022.[22] In sum, the model results show that while the house price decline in the previous two downturns was mainly driven by housing-specific demand shocks, the latest downturn in house prices was characterised by a variety of factors, with prominence being given to the lasting effects of the pandemic and other subsequent adverse macroeconomic shocks.
Box 2
The relation between rental and house prices: how indicative is this for the euro area?
The asset pricing model and the user cost of capital model provide conceptual frameworks for housing valuation. The first model works with the discounted flow of future rental income, the second with the annual cost of a unit of owner-occupied housing services. To the extent that owner-occupied housing costs can be approximated by rental prices, both frameworks can entail a long-term theoretical relation between house prices and rental prices.[23] House prices should therefore be high, as compared with rental prices, when, among other things, interest rates are low, expected house price appreciation is high, the risk premium for holding a housing asset is low or maintenance costs are low. Over the past 25 years, house prices in the euro area more than doubled and, on average, substantially outpaced rental prices. The house price-to-rental price ratio drifted upwards from its long-term average for protracted periods of time and remained above this average even after the recent correction of house prices (Chart A).[24] Such a situation would normally suggest a downside risk to house price growth and an upside risk to rental price growth, as it suggests that buying is relatively expensive as compared to renting, with households adjusting their relative demand.
Chart A
House prices, rental prices and the house price-to-rental price ratio in the euro area
(index 1999 = 100)
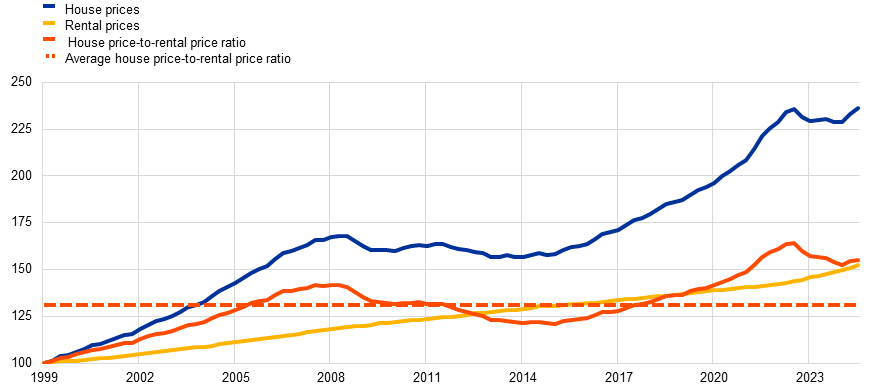
Sources: Eurostat and ECB staff calculations.
Notes: The latest observations are for the third quarter of 2024.
Chart B
Euro area house price-to-rental price ratio across boom-bust cycles
(index, peak (T) = 100)
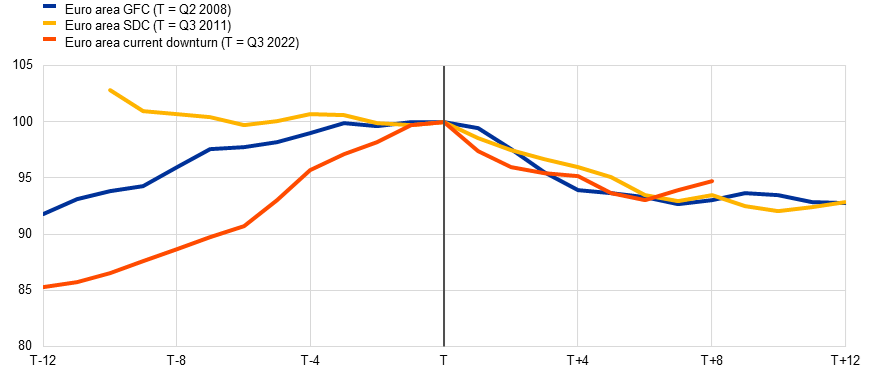
Sources: Eurostat and ECB staff calculations.
Notes: The latest observations are for the third quarter of 2024.
The magnitude of decline in the house price-to-rental price ratio following a house price peak is broadly comparable across boom-bust house price cycles. This holds true even in the recent house price cycle, albeit the increase in this ratio in the run-up to the peak was much stronger than during the GFC and SDC cycles owing to the sizeable and sustained increase in house prices until mid-2022 (Chart B). This is in line with the extended period of exceptionally low interest rates, the expectation of house price appreciation likely triggered by sustained increases in house prices, or with a lower risk-premium of holding a housing asset in times when transactions were high and working from home options lowered the hurdle for tying oneself to a house rather than retaining flexibility by renting.
Beyond economic and financial considerations, the decision between renting and buying is also related to preferences. According to the ECB’s Consumer Expectation Survey (CES), the “desire to own instead of renting” was the third most important reason for moving in the period from February 2023 to February 2024.[25] The total share of euro area households renting a property increased by around 1 percentage point since 2020 to close to 35% in 2023. Such developments can have many grounds (including country-specific motives). For example, a limited housing supply, tighter financing conditions or reduced access to credit can make purchasing a property more difficult and push households towards renting. In addition, regulation and consumer protection in the rental market can make renting a preferred option.[26] The stickiness of rents due to regulation and the fact that HICP rental prices primarily cover existing contracts call for caution in using the house price-to-rental price ratio as an unambiguous valuation measure and indication of whether there is an adjustment need for house prices. This is underpinned by evidence from a new rental price indicator based on the ECB’s CES, which shows that dynamics in rental prices have lately been driven increasingly by recent moves towards rental accommodation (see the box entitled “Euro area rent developments: insights from the CES” in this issue of the Economic Bulletin).
To this end, an additional useful gauge to benchmark house prices are the actual costs incurred to acquire and maintain a property as summarised in Eurostat’s owner-occupied housing price index (OOHPI). While the house price-to-rental price ratio remains well above its long-term average, the house price-to-OOHPI ratio did not increase as much in the first instance, declining substantially, however, during the recent house price downturn as the OOHPI continued to show moderating but positive rates of growth (Chart C). The recent large gap observed between the two ratios can be explained by considering the breakdown of the OOHPI into its acquisition and maintenance components. These illustrate that the major repairs and maintenance costs of owned property (quite aside from the acquisition costs) have been developing more dynamically than rental prices. This underpins the notion that a high share of existing rental contracts (possibly fixed for extended periods) in the rental price index does not necessarily make this index a good benchmark for assessing whether house prices correspond to the fundamental conditions in real time.
Chart C
Ratios of house prices to rental prices and housing costs in the euro area
(index 2015=100)
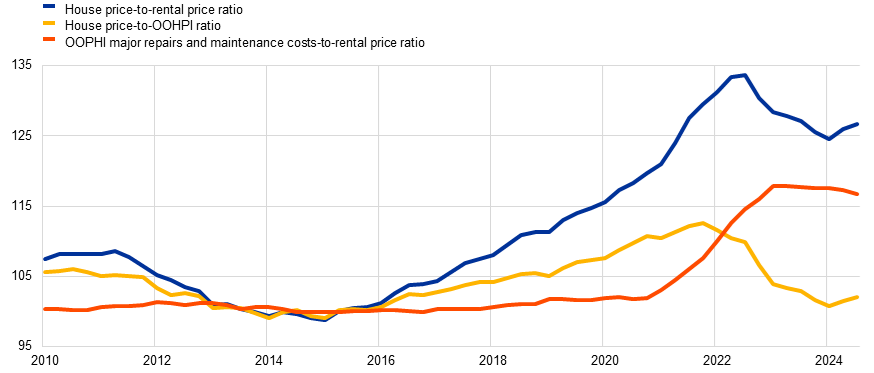
Sources: Eurostat and ECB staff calculations
Notes: Data for the owner-occupied housing price index are available from 2010 to the third quarter of 2024. The latest observations are for the third quarter of 2024.
4 Conclusion
The latest data confirm that the recent downturn in house prices was relatively mild compared with previous bust periods. By the third quarter of 2024, the level of house prices in the euro area had moved back above the earlier peak level in 2022. While estimates of housing valuations are surrounded by uncertainty, current readings imply that the relatively mild and short-lived decline in house prices implied less adjustment to overvaluations than had been observed during the GFC and the SDC house price cycles (although this adjustment has been more substantial in measures derived on the basis of real house prices). One reason for the limited adjustment is that the bust in house prices took place in a limited number of countries and, therefore, did not bear the same hallmarks as an outright recession as in previous periods, with income fundamentals remaining solid in the most recent house price cycle. In this respect, it resembled an orderly unwinding of the additional boost in house prices recorded during the pandemic period.
While a relatively shallow bust in house prices circumvents adverse consequences for household and bank balance sheets, the level of house prices have remained high. This has negatively affected the affordability of housing despite a meanwhile less tight monetary policy. High construction costs and high purchase prices for housing currently stand in the way of generating additional supply in the housing market, which also implies scarcity in the rental market. In view of the combination of supply limitations and continued sound demand fundamentals, house price developments may well continue on their upward path, even though this may not be an entirely healthy outlook for the economy as a whole.
The ECB Consumer Expectations Survey (CES) shows an increase in house price expectations before the most recent peak in house prices. The role of expectations and possible exuberance are in line with the theory that housing is held as an asset for which the value should appreciate over time. Asset pricing theory is a common concept used to assess house price developments. See, for instance, the box entitled “The impact of rising mortgage rates on the euro area housing market”, Economic Bulletin, Issue 6, ECB, 2022.
See “Real and financial cycles in EU countries: stylised facts and modelling implications”, Occasional Paper Series, No 205, ECB, January 2018.
In real terms, the cumulative decline in the most recent house price cycle was around 10% when adjusting house prices to developments in the GDP deflator (compared with 6% during the GFC and 8% during the SDC) or to developments in the HICP inflation indicator (compared with 7% during the GFC and 9% during the SDC). Real house prices can be seen as accounting for changes in purchasing power and therefore they can approximate changes in affordability, which is useful in the analysis of longer-term house price trends. That said, the strong surge in the general inflation cycle was initially accompanied by losses in purchasing power, as it took a while for these losses to be recouped through higher nominal wage growth.
Estimates of house price over/undervaluation are surrounded by uncertainty and there can be large differences between different measures in terms of levels and developments. For instance, measuring the overvaluation based on real house prices suggests that the correction has now already taken place.
This is confirmed by OECD relocation data available until the fourth quarter of 2022 (most countries only show up to the fourth quarter of 2021), illustrating a shift in demand away from metropolitan centres to suburbs in close proximity to metropolitan centres (reduction in the price-to-distance-gradient) or to small cities (however not necessarily to rural areas as such). See “Expanding the doughnut? How the geography of housing demand has changed since the rise of remote work with COVID-19”, OECD Regional Development Papers, OECD, 11 October 2023.
See the box entitled “The impact of rising mortgage rates on the euro area housing market”, Economic Bulletin, Issue 6, ECB, 2022. Eurostat’s data on housing and living conditions suggest that the rate of housing cost overburden was larger in cities than rural areas in recent years, and that there was a temporary increase in the share of people living in overcrowded homes during the pandemic years.
See, for instance, “House prices and ultra-low interest rates: exploring the non-linear nexus” Empirical Economics, September 2024 or “Drivers of rising house prices and the risk of reversal”, Financial Stability Review, ECB, May 2022.
For an example of different demand and supply factors in the housing market, see the article entitled “The state of the euro area housing market”, Economic Bulletin, Issue 7, ECB, 2018.
See Richard, M., “Working from home: Effects on housing demand and inequality”, The ECB Blog, 8 January 2025. The COVID-19 lockdowns induced a structural change in the organisation of work (i.e. working from home), changing what residents looked for in a house, increasing overall demand for housing but in particular for larger properties located further away from city centres.
See “Analysing drivers of residential real estate (RRE) prices and the effects of monetary policy tightening on RRE vulnerabilities”, Macroprudential Bulletin, Issue 10, ECB, 2022.
See Eurostat’s data on housing cost overburden by tenure status. The latest available data for the euro area are for 2023.
Across relevant indicators, average house price overvaluation in mid-2022 remained above 10% (Chart 2, panel b). However, measures deriving valuations on the basis of real house prices, and thus accounting for the surge in inflation, suggest that overvaluation had already unwound by that stage.
See, for instance, “Assessing the strength of the recent residential real estate expansion”, Financial Stability Review, ECB, November 2021.
According to the ECB Financial Stability Review in November 2023, estimates based on nowcasted survey data show that over 30% of the euro area’s outstanding fixed rate mortgage stock is expected to expire within the next ten years.
For a discussion, see the box entitled “Why has housing lost its lure? Evidence from the ECB’s Consumer Expectations Survey”, Economic Bulletin, Issue 5, ECB, 2023.
See, for instance, Castellanos et al., “The aggregate and distributional implications of credit shocks on housing and rental markets”, Working Paper Series, No 2977, ECB, 2024.
All variables are included in log levels, except for the short-term risk-free interest rate and the long-term interest rate spread, which are measured in levels. The short-term risk-free interest rate refers to the three-month EURIBOR and the long-term interest rate spread is the difference between the euro area ten-year government bond yield and the short-term risk-free interest rate.
See, among others, Smets, F. and Jarociński, M., “House prices and the stance of monetary policy”, Working Paper Series, No 891, ECB, April 2008; and Nocera, A. and Roma, M., “House prices and monetary policy in the euro area: evidence from structural VARs”, Working Paper Series, No 2073, ECB, June 2017.
See, for instance, Baumeister, C. and Benati, L., “Unconventional Monetary Policy and the Great Recession: Estimating the Macroeconomic Effects of a Spread Compression at the Zero Lower Bound”, International Journal of Central Banking, Vol. 9, Issue 2, June 2013, pp. 165-212.
The model takes account of the marked volatility of macroeconomic data in 2020 by using a pandemic heteroskedasticity adjustment. See Lenza, M. and Primiceri, G., “How to estimate a vector autoregression after March 2020”, Journal of Applied Econometrics, Vol. 37, Issue 4, June 2022, pp. 688-699.
See the article entitled “The euro area housing market during the COVID-19 pandemic”, Economic Bulletin, ECB, Issue 7, 2021 and Gamber, W., Graham, J. and Yadav, A., “Stuck at home: Housing demand during the COVID-19 pandemic”, Journal of Housing Economics, Vol. 59, Part B, March 2023.
This result is also due to a larger role of term spread shocks relative to risk-free rate shocks in explaining house price fluctuations on average (with the opposite applying to housing investment). This is consistent with the larger importance of unconventional relative to conventional monetary policy shocks in house prices (with the opposite applying to construction value added), documented by Battistini, N., Falagiarda, M., Hackmann, A. and Roma, M., “Navigating the housing channel of monetary policy across euro area regions”, European Economic Review, Vol. 171, January 2025, 104897.
For a discussion, see, for instance, Dieckelmann et al., “House prices and ultra-low interest rates: exploring the non-linear nexus”, Working Paper Series, No 2789, ECB, February 2023.
See the box entitled “Rent inflation in the euro area since the crisis”, Economic Bulletin, Issue 4, ECB, 2019. Note that the actual rent component in the HICP mainly reflects existing contracts and only in part new lettings, which are more subject to market forces and more responsive to housing market conditions.
Around one-quarter of those households that moved mentioned the “desire to own instead of renting”. The first reason was the “desire to improve living conditions” and the second the “desire to spend less on housing”. For further details, see the box entitled “Euro area rent developments: insights from the CES” in this issue of the Economic Bulletin, ECB, 2025.
See, for instance, Castellanos, J., Hannon, A. and Paz-Pardo, G., “The aggregate and distributional implications of credit shocks on housing and rental markets”, which shows that a shock that reduces credit access to potential mortgagors increases rents, reduces house prices and decreases homeownership rates, Working Paper Series, No 2977, ECB, 2024.