


Published as part of the ECB Economic Bulletin, Issue 2/2025.
Business investment in the euro area has grown less dynamically – and its outlook remains less favourable – than in the United States.[1] In the post-pandemic period between the fourth quarter of 2021 and the fourth quarter of 2024, business investment grew by 15.4% in the United States – more than double the 6.8% cumulative increase over this period in the euro area (Chart A).[2] Across components, intangible investment – i.e. intellectual property products (IPP) – has contributed most to the differential, with euro area growth in intangibles (excluding volatile Irish IPP) only half that in the United States. In terms of the other main asset classes, transport equipment contributed only slightly less to investment in the euro area than in the United States. At the same time machinery and equipment investment declined in the euro area, while remaining slightly positive in the United States.
Chart A
Business investment and breakdown by asset
a) Euro area | b) United States |
|---|---|
(cumulated percentage changes and percentage point contributions) | (cumulated percentage changes and percentage point contributions) |
 | |
Sources: Eurostat, US Bureau of Economic Analysis, and ECB staff calculations.
Notes: Euro area non-construction investment and intangibles exclude intellectual property products (IPP) in Ireland. Non-construction investment in the United States refers to private fixed non-residential investment excluding structures. Intangibles refers to IPP. The latest observations are for the fourth quarter of 2024.
Weaker tangible investment in the euro area can be partly explained by lower demand. Since early 2022 domestic demand for goods – which is a key driver of tangible investment in machinery and equipment, including transport – has been considerably more subdued in the euro area. This has resulted in capacity utilisation falling markedly below its historical average since mid-2023 (Chart B, panel a). Stronger aggregate demand in the United States, supported by a swift deployment of investment-boosting policy measures, kept manufacturing capacity utilisation above its pre-pandemic average. In addition, sharper rises in energy prices in the euro area, coupled with heightened geopolitical uncertainty following Russia’s invasion of Ukraine, are likely to have dampened euro area demand for investment to a greater degree than in the United States, given the EU’s greater reliance on Russian gas as an energy source and proximity to the war zone. They would have had an impact both directly, through higher production costs and lower confidence, and indirectly, through competitiveness losses in export markets.[3] Confidence in the euro area has shown a particularly strong and extended decline since 2022 (Chart B, panel b). The fact that economic policy uncertainty was higher in the euro area than in the United States over this period also acted as a stronger drag on demand for investment in the euro area compared with the United States (Chart B, panel c).[4]
Chart B
Capacity utilisation, manufacturing Purchasing Managers’ Index and economic policy uncertainty
a) Capacity utilisation | b) Manufacturing Purchasing Managers’ Index | c) Economic policy uncertainty |
|---|---|---|
(percentage point deviation from historical mean) | (diffusion indices) | (standardised index) |
 |  |  |
Sources: The European Commission’s Directorate General for Economic and Financial Affairs; S&P Global Market Intelligence; Baker et al. “Measuring Economic Policy Uncertainty”, The Quarterly Journal of Economics, Vol. 131, No 4, November 2016, pp. 1593-1636; and ECB staff calculations.
Notes: Capacity utilisation is shown as the deviation from the 1999-2019 mean and euro area economic policy uncertainty is the GDP-weighted average for the four largest euro area economies (standardised over 1999-2019). The latest observations are for January 2025 for capacity utilisation in the United States, for February 2025 for both the Purchasing Managers’ Index (PMI) and economic policy uncertainty, and for the first quarter of 2025 for capacity utilisation in the euro area.
There is also a significant intangible investment differential, related to innovation and research and development (R&D) spending, contributing to a widening productivity gap between the EU and the United States. According to the European Investment Bank’s Investment Survey 2024, which provides comparative data from a large survey of firms in the United States and the EU, expansion of capacity has been a greater driver of investment in the United States than in the EU. By contrast in the EU the primary purpose of investment has been replacement (Chart C, panel a).[5] US firms’ investment also tends to focus more on innovation than that of firms in the EU (Chart C, panel b). The 2024 EU Industrial R&D Scoreboard shows that euro area R&D investment is focused on mature industries such as cars and equipment, while in the United States it is increasingly concentrated in ICT-based activities, including data centres and artificial intelligence-related facilities. Intangible investment is key for longer-term growth and is likely contributing to the rising productivity gap between the two economies.[6]
Chart C
Investment and innovation
a) Purpose of investment spending | b) Firm innovation |
|---|---|
(percentage of investment) | (percentage of firms) |
 |  |
Source: European Investment Bank (EIB) Investment Survey 2024.
Notes: In panel a), the figures may not add up to 100 due to rounding. In panel b), the data are based on replies to two questions on the proportion of total investment devoted to developing or introducing new products, processes or services, with a breakdown into innovations new to the company, to the country or to the global market. The latest observations are for 2024.
Firms point to higher obstacles to investment in the EU than in the United States. In the EU the main obstacles reported by corporates relate to a lack of skilled staff, high energy costs, elevated uncertainty and onerous regulation, according to the EIB Investment Survey 2024 (Chart D). Both energy costs and uncertainty appear to be somewhat more important in the EU than in the United States, in part reflecting the greater exposure of EU firms to the impact of Russia’s war in Ukraine. While uncertainty could be seen as a temporary factor, large and long-standing differences in energy costs, regulations in product and labour markets, and aspects related to productivity differentials are likely to be more persistent.[7] Heavier regulation is also contributing to a less dynamic corporate landscape in the euro area, with fewer firm entries and exits, and typically weaker firm growth. This is likely to hold back investment, notably in intangibles.[8]
Chart D
Perceived major obstacles to investment
(percentage point contributions)
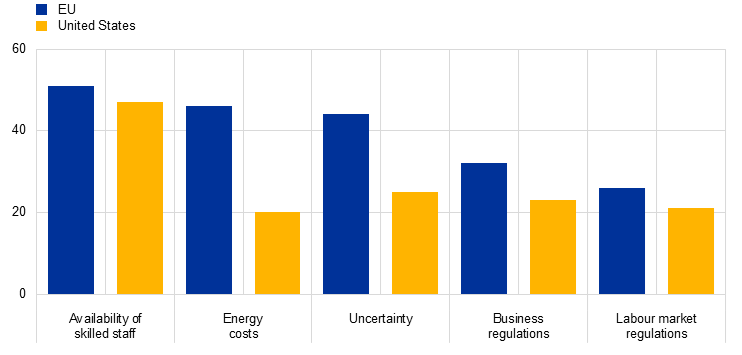
Source: EIB Investment Survey 2024.
Note: The latest observations are for 2024.
A faster implementation of investment-boosting policies also helped shape the swifter and stronger rebound in US investment. While the Next Generation EU (NGEU) funds, amounting to €750 billion, are expected to boost EU business investment in digitalisation and the green transition, their deployment has been very gradual and delayed. The size of the associated fiscal multipliers is also uncertain.[9] In the United States, the Inflation Reduction Act (IRA) combined with the CHIPS and Science Act amount to about USD 835 billion of spending on clean energy and chip manufacturing. This is slightly larger than the NGEU programme in the EU in absolute terms, but represents a smaller share of GDP. These programmes have already given a major boost to US private non-residential investment in structures, which is not included in Chart A. The impact is particularly visible in manufacturing investment – especially investment in factories, which increased by more than in the EU.[10] The faster deployment of IRA funding compared with the NGEU may in part reflect the greater maturity of the single market in the United States. In addition, the IRA focuses on federal direct tax credits to firms and households, while in the EU tax policies remain national.[11]
Recent EU policy initiatives to improve the investment environment in the euro area should help to close the gap with the United States. The European Commission’s newly-announced Competitiveness Compass is a welcome step forward. Notably, the Compass aims to boost competitiveness and innovation through the following measures: simplifying and reducing the regulatory burden, removing barriers to fully benefiting from the Single Market, better coordinating policies at EU and national level, and improving access to – and affordability of – financing. It is thus vital to advance the capital markets union agenda, particularly as more sophisticated venture capital markets would make it easier for innovative EU firms to access risk capital and to grow. The swift implementation of these measures is of the utmost importance.
For earlier analysis, see the box entitled “The post-pandemic recovery – why is the euro area growing more slowly than the United States?”, Economic Bulletin, Issue 4, ECB, 2024.
The detailed national accounts data became available shortly after the cut-off date for this issue of the Economic Bulletin. Business investment is proxied by whole-economy non-construction investment in the euro area (excluding the volatile Irish IPP) and private fixed non-residential non-structural investment in the United States. For the euro area, see “Intangible assets of multinational enterprises in Ireland and their impact on euro area activity”, Occasional Paper Series, No 350, ECB, 2024.
See the article entitled “Past and future challenges for the external competitiveness of the euro area”, Economic Bulletin, Issue 6, ECB, 2024.
See, for instance, the box entitled “What are the economic signals from uncertainty measures?”, Economic Bulletin, Issue 8, ECB, 2024 and Chen et al., “Economic policy uncertainty and firm investment: evidence from the U.S. market” Applied Economics, Vol. 51, No 31, 2019, pp. 3423-3435, for an assessment the adverse impact of policy uncertainty on investment.
The euro area breakdown is not yet available.
See McKinsey & Company, “Getting tangible about intangibles: The future of growth and productivity?”, 2021; the box entitled “Labour productivity growth in the euro area and the United States: short and long-term developments”, Economic Bulletin, Issue 6, ECB, 2024; and Herzog, Stein and Horn, “The Productivity Puzzle: It’s the Lack of Investment, Stupid!”, Intereconomics, No 2, 2018.
See the article entitled “European competitiveness: the role of institutions and the case for structural reforms”, Economic Bulletin, Issue 1, ECB, 2025.
See Thum-Thysen et al., “Investment dynamics in Europe: Distinct drivers and barriers for investing in intangible versus tangible assets?”, Vol. 51, December 2019, pp. 77-88.
See the article entitled “Four years into the Next Generation EU programme: an updated preliminary evaluation of its economic impact”, Economic Bulletin, Issue 8, ECB, 2024 on the economic impact and “The real effects of Next Generation EU”, Recovery Watch, 2024, on the fiscal multipliers.
The IRA spurred investment in factories and other production facilities, notably the construction of data centres – a development which has been much less pronounced in the EU except in Ireland. As President Trump halted all IRA-related disbursements as of 20 January 2025, its potential long-term benefits are in doubt. Investment in non-residential manufacturing structures in the United States grew by 112% between the end of 2021 and the third quarter of 2024, although it only amounted to 0.5% of GDP and less than 4% of private non-residential fixed investment.
See Cahen et al., “Is Next Generation EU a game changer? A Comparison with IRA and ways to respond”, Eurofi Regulatory Update, February 2024.