
Economic, financial and monetary developments
Overview
Inflation is projected to remain too high for too long. Therefore, on 16 March 2023 the Governing Council decided to increase the three key ECB interest rates by 50 basis points, in line with its determination to ensure the timely return of inflation to the 2% medium-term target. The elevated level of uncertainty reinforces the importance of a data-dependent approach to the Governing Council’s policy rate decisions, which will be determined by its assessment of the inflation outlook in light of the incoming economic and financial data, the dynamics of underlying inflation, and the strength of monetary policy transmission.
The Governing Council also announced that it was monitoring current market tensions closely. It stands ready to respond as necessary to preserve price stability and financial stability in the euro area. The Governing Council said that the euro area banking sector was resilient, with strong capital and liquidity positions. In any case, the ECB’s policy toolkit is fully equipped to provide liquidity support to the euro area financial system if needed and to preserve the smooth transmission of monetary policy.
The new ECB staff macroeconomic projections were finalised in early March before the recent emergence of financial market tensions. As such, these tensions imply additional uncertainty around the baseline assessments of inflation and growth. Prior to these latest developments, the baseline path for headline inflation had already been revised down, mainly owing to a smaller contribution from energy prices than previously expected. ECB staff now see inflation averaging 5.3% in 2023, 2.9% in 2024 and 2.1% in 2025. At the same time, underlying price pressures remain strong. Inflation excluding energy and food continued to increase in February and ECB staff expect it to average 4.6% in 2023, which is higher than foreseen in the December projections. Subsequently, it is projected to come down to 2.5% in 2024 and 2.2% in 2025, as the upward pressures from past supply shocks and the reopening of the economy fade out and as tighter monetary policy increasingly dampens demand.
The baseline projections for growth in 2023 have been revised up to an average of 1.0% as a result of both the decline in energy prices and the economy’s greater resilience to the challenging international environment. ECB staff then expect growth to pick up further, to 1.6%, in both 2024 and 2025, underpinned by a robust labour market, improving confidence and a recovery in real incomes. At the same time, the pick-up in growth in 2024 and 2025 is weaker than projected in December, owing to the tightening of monetary policy.
Economic activity
Global economic activity remained subdued at the turn of the year, but near-term prospects have brightened, buoyed by China’s economic reopening and the continued resilience of labour markets across advanced economies. The easing of supply constraints continues to underpin global trade and, despite headline inflation declining, underlying price pressures remain strong. Against this backdrop, the global growth outlooks for 2023 and 2024 included in the March 2023 ECB staff macroeconomic projections for the euro area have been revised upwards compared with the December 2022 Eurosystem staff macroeconomic projections. While the reopening of China’s economy will support global growth this year, global economic activity remains relatively subdued, with growth rates still below historical averages over the whole projection horizon from 2023 to 2025. Global trade projections have also been revised upwards to reflect China’s economic reopening and the further easing of global supply chain constraints. There are growing signs that global consumer price index (CPI) inflation already peaked in 2022, although price pressures in the global economy remain high. Disinflation is being bolstered by waning supply disruptions, falling energy prices and synchronised monetary policy tightening across the world. However, resilient labour markets and strong wage growth, especially in major advanced economies, suggest that underlying inflationary pressures in the global economy remain strong and that the disinflation process will be gradual.
The euro area economy stagnated in the fourth quarter of 2022, thus avoiding the previously expected contraction. However, private domestic demand fell sharply. High inflation, prevailing uncertainties and tighter financing conditions dented private consumption and investment, which fell by 0.9% and 3.6% respectively. Under the baseline, the economy looks set to recover over the coming quarters. Industrial production should pick up as supply conditions improve further, confidence continues to recover, and firms work off large order backlogs. Rising wages and falling energy prices will partly offset the loss of purchasing power that many households are experiencing as a result of high inflation. This, in turn, will support consumer spending. Moreover, the labour market remains strong, despite the weakening of economic activity. Employment grew by 0.3% in the fourth quarter of 2022 and the unemployment rate stayed at its historical low of 6.6% in January 2023.
With energy supplies becoming more secure, energy prices have eased significantly, confidence has improved and activity should pick up somewhat in the short term. Lower energy prices are now providing some cost relief, particularly for energy-intensive industries, and global supply bottlenecks have largely dispersed. The energy market is expected to continue rebalancing and real incomes are expected to improve. With foreign demand also strengthening, and provided current financial market tensions subside, output growth is expected to rebound as of mid-2023, underpinned by a robust labour market. Nevertheless, the ECB’s ongoing policy normalisation and further rate hikes expected by markets will increasingly feed through to the real economy, with additional dampening effects stemming from a recent tightening in credit supply conditions. This, together with the gradual withdrawal of fiscal support and some remaining concerns about risks to the energy supply next winter, will weigh on economic growth in the medium term. Overall, annual average real GDP growth is expected to slow to 1.0% in 2023 (from 3.6% in 2022), before rebounding to 1.6% in 2024 and 2025. Compared with the December 2022 Eurosystem staff macroeconomic projections, the outlook for GDP growth has been revised up by 0.5 percentage points for 2023 owing to a carry-over from the positive surprises in the second half of 2022 and an improved short-term outlook. For 2024 and 2025, it has been revised down by 0.3 percentage points and 0.2 percentage points respectively, as the tightening of financing conditions and the recent appreciation of the euro outweigh the positive income and confidence effects of lower inflation.
According to ECB staff March 2023 projections, the euro area fiscal outlook is set to improve over the projection horizon. After the significant decline estimated for 2022, the euro area budget deficit is projected to continue to decline somewhat in 2023 and more significantly in 2024 (to 2.4% of GDP), remaining unchanged in 2025. The decline in the budget balance at the end of the projection horizon, compared with 2022, is explained by the improvement in the cyclically adjusted primary balance and by a better cyclical component, while interest payments gradually increase as a share of GDP over the projection horizon. Euro area debt is projected to continue to decline, albeit more slowly after 2022, to slightly below 87% of GDP by 2025. This is mainly on account of negative interest rate-growth differentials, which more than offset the persisting primary deficits. Nevertheless, in 2025, both the deficit and the debt ratios are expected to remain above pre-pandemic levels. Compared with the December projections, the budget balance path has been revised up over 2023-25, albeit only marginally at the end of the projection horizon, while interest payments have increased over 2024-25. The debt ratio has been revised down, reflecting mainly the improvement in the primary balance path.
Government support measures to shield the economy from the impact of high energy prices should be temporary, targeted and tailored to preserving incentives to consume less energy. As energy prices fall and risks around the energy supply recede, it is important to start rolling back these measures promptly and in a concerted manner. Measures falling short of these principles are likely to drive up medium-term inflationary pressures, which would call for a stronger monetary policy response. Moreover, in line with the EU’s economic governance framework and as stated in the European Commission’s guidance of 8 March 2023, fiscal policies should be oriented towards making the euro area economy more productive and gradually bringing down high public debt. Policies to enhance the euro area’s supply capacity, especially in the energy sector, can help reduce price pressures in the medium term. To that end, governments should swiftly implement their investment and structural reform plans under the Next Generation EU programme. The reform of the EU’s economic governance framework should be concluded rapidly.
Inflation
Inflation edged down to 8.5% in February. The decline resulted from a renewed sharp drop in energy prices. By contrast, food price inflation increased further, to 15.0%, with the past surge in the cost of energy and of other inputs for food production still feeding through to consumer prices.
Moreover, underlying price pressures remain strong. Inflation excluding energy and food increased to 5.6% in February and other indicators of underlying inflation have also stayed high. Non-energy industrial goods inflation rose to 6.8% in February, mainly reflecting the delayed effects of past supply bottlenecks and high energy prices. Services inflation, which rose to 4.8% in February, is also still being driven by the gradual pass-through of past energy cost increases, pent-up demand from the reopening of the economy and rising wages.
Wage pressures have strengthened on the back of robust labour markets and employees aiming to recoup some of the purchasing power lost owing to high inflation. Moreover, many firms were able to raise their profit margins in sectors faced with constrained supply and resurgent demand. At the same time, most measures of longer-term inflation expectations currently stand at around 2%, although they warrant continued monitoring, especially in light of recent volatility in market-based inflation expectations.
The sharp adjustment in energy markets has led to a significant decline in price pressures, and inflation is now expected to fall at a faster pace. Energy inflation, which peaked above 40% last autumn, should turn negative in the second half of 2023 on the back of commodity prices falling below levels last seen before Russia’s invasion of Ukraine, strong base effects and the stronger euro exchange rate. The more benign energy commodity price outlook implies fiscal measures should play a somewhat lesser role in lowering energy prices in 2023 and, with the withdrawal of the measures, a smaller rebound is now expected in energy inflation in 2024.
Inflation rates for other components of the Harmonised Index of Consumer Prices (HICP) are expected to start unwinding slightly later, as pipeline pressures related to cost pass-through, especially for food inflation, as well as lingering effects from past supply bottlenecks and the reopening of the economy, will still be present in the near term. Headline inflation is expected to fall below 3.0% by the end of 2023 and to stabilise at 2.9% in 2024, before moderating further to the inflation target of 2.0% in the third quarter of 2025 while averaging 2.1% for the year. In contrast to headline inflation, core inflation as measured by HICP inflation excluding energy and food will, on average, be higher in 2023 than in 2022, reflecting lagged effects related to indirect effects both from past high energy prices and from the past strong depreciation of the euro, which will dominate in the short term. The effects on core inflation from the more recent energy price declines and the euro’s recent appreciation will be felt only later in the projection horizon. The expected decline in inflation in the medium term also reflects the gradual impact of monetary policy normalisation. Nevertheless, tight labour markets and inflation compensation effects imply that wages are expected to grow at rates well above historical averages and, by the end of the horizon, stand in real terms at levels close to those of the first quarter of 2022. Compared with the December 2022 projections, headline inflation has been revised down across the projection horizon (by 1.0 percentage point for 2023, by 0.5 percentage points for 2024 and by 0.2 percentage points for 2025). The sizeable downward revision for 2023 is driven by large downward surprises related to energy inflation in recent months and much lower energy price assumptions, partially offset by upward data surprises for HICP inflation excluding energy and food. For 2024 and 2025, the downward revisions relate to a lower impact on energy inflation from the reversal of fiscal measures, more strongly fading indirect effects and an increasing pass-through of the euro’s recent appreciation.
Risk assessment
Risks to the outlook for economic growth are tilted to the downside. Persistently elevated financial market tensions could tighten broader credit conditions more strongly than expected and dampen confidence. Russia’s unjustified war against Ukraine and its people continues to be a significant downside risk to the economy and could again push up the costs of energy and food. There could also be an additional drag on euro area growth if the world economy weakened more sharply than expected. However, companies could adapt more quickly to the challenging international environment and, together with the fading-out of the energy shock, this could support higher growth than currently expected.
The upside risks to inflation include existing pipeline pressures that could still send retail prices even higher than expected in the near term. Domestic factors, such as a persistent rise in inflation expectations above the Governing Council’s target or higher than anticipated increases in wages and profit margins, could drive inflation higher, including over the medium term. Moreover, a stronger than expected economic rebound in China could give a fresh boost to commodity prices and foreign demand. The downside risks to inflation include persistently elevated financial market tensions that could accelerate disinflation. In addition, falling energy prices could translate into reduced pressure from underlying inflation and wages. A weakening of demand, including owing to a stronger deceleration of bank credit or a stronger than projected transmission of monetary policy, would also contribute to lower price pressures than currently anticipated, especially over the medium term.
Financial and monetary conditions
Market interest rates rose considerably in the weeks following the Governing Council’s February meeting. But the increase reversed strongly in the run-up to the March meeting in a context of severe financial market tensions. Bank credit to euro area firms has become more expensive. Credit to firms has weakened further, owing to lower demand and tighter credit supply conditions. Household borrowing has become more expensive as well, especially owing to higher mortgage rates. This rise in borrowing costs and the resultant decline in demand, along with tighter credit standards, have led to a further slowdown in the growth of loans to households. Amid these weaker loan dynamics, money growth has slowed sharply, driven by its most liquid components.
Monetary policy decisions
Based on its current assessment, the Governing Council decided to raise the three key ECB interest rates by 50 basis points. Accordingly, the interest rate on the main refinancing operations and the interest rates on the marginal lending facility and the deposit facility will be increased to 3.50%, 3.75% and 3.00% respectively, with effect from 22 March 2023.
The asset purchase programme (APP) portfolio is declining at a measured and predictable pace, as the Eurosystem does not reinvest all of the principal payments from maturing securities. The decline will amount to €15 billion per month on average until the end of June 2023 and its subsequent pace will be determined over time. As concerns the pandemic emergency purchase programme (PEPP), the Governing Council intends to reinvest the principal payments from maturing securities purchased under the programme until at least the end of 2024. In any case, the future roll-off of the PEPP portfolio will be managed to avoid interference with the appropriate monetary policy stance. The Governing Council will continue applying flexibility in reinvesting redemptions coming due in the PEPP portfolio, with a view to countering risks to the monetary policy transmission mechanism related to the pandemic.
As banks are repaying the amounts borrowed under the targeted longer-term refinancing operations, the Governing Council will regularly assess how targeted lending operations are contributing to its monetary policy stance.
Conclusion
Summing up, inflation is projected to remain too high for too long. Therefore, at its March meeting, the Governing Council decided to increase the three key ECB interest rates by 50 basis points, in line with its determination to ensure the timely return of inflation to the 2% medium-term target.
The elevated level of uncertainty reinforces the importance of a data-dependent approach to policy rate decisions, which will be determined by the Governing Council’s assessment of the inflation outlook in light of the incoming economic and financial data, the dynamics of underlying inflation, and the strength of monetary policy transmission.
The Governing Council stands ready to adjust all of its instruments within its mandate to ensure that inflation returns to its 2% target over the medium term and to preserve the smooth functioning of monetary policy transmission.
1 External environment
Global economic activity remained subdued at the turn of the year, but near-term prospects have brightened, helped by China’s economic reopening and still resilient labour markets across advanced economies. The easing of supply constraints continues to support global trade. Despite headline inflation declining, underlying price pressures remain strong. Against this backdrop, the global growth outlook for 2023 and 2024, as embedded in the March 2023 ECB staff macroeconomic projections for the euro area, has been revised upwards compared with the December 2022 Eurosystem staff macroeconomic projections for the euro area. While the reopening of China’s economy will bolster global growth this year, world economic activity remains relatively muted, with growth rates remaining below historical averages over the whole projection horizon from 2023 to 2025. Global trade projections have also been revised upwards to reflect China’s economic reopening and the further easing of global supply chain constraints. There are growing signs that global consumer price index (CPI) inflation had already peaked in 2022, although price pressures in the global economy remain high. Disinflation is being supported by waning supply disruptions, falling energy prices and synchronised monetary policy tightening across the globe. However, resilient labour markets and strong wage growth, especially in major advanced economies, suggest that underlying inflationary pressures in the global economy remain strong.
High inflation, monetary policy tightening and the pandemic-related supply disruptions in China dampened global growth at the turn of the year. Together with the heightened geopolitical uncertainty related to the war in Ukraine and lingering supply risks for global energy and food commodity markets, these factors weighed on economic activity, with global real GDP growth decreasing sharply to an estimated 0.4% in the fourth quarter of 2022.[1] While this was broadly in line with the December 2022 projections, two opposing forces have been at play. First, the abrupt lifting of the public health containment policies in China triggered a sharp increase in COVID-19 infection rates, pointing, in the short term, to much weaker economic activity than had been previously expected. Second, real GDP growth in the United States came in stronger than anticipated, owing to a large positive contribution from net exports and inventories, although domestic demand moderated further.
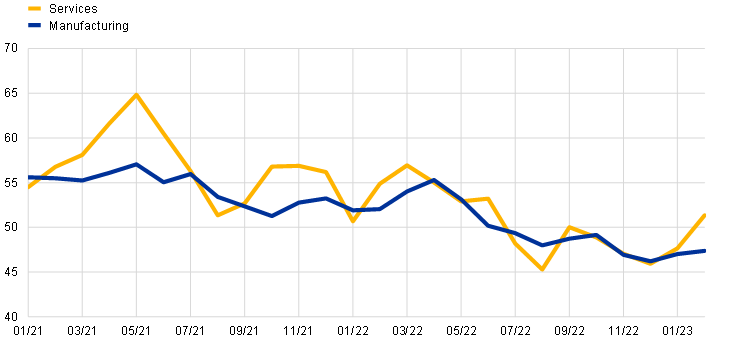
Global real GDP growth is expected to increase in the first quarter of 2023 but remains subdued. The increase reflects the fact that the recent pandemic-related disruptions in China appear to be abating already and that labour market performance in advanced economies remains strong. It is also in line with the indications derived from the latest Purchasing Managers’ Index (PMI) surveys, which suggest an improvement in economic activity. Across advanced economies, services sector output has risen recently alongside ongoing labour market resilience, while manufacturing output remains in contractionary territory (Chart 1, panel a). In China, recovery from the disruptions is well under way, with the outputs from both manufacturing and the services sector rebounding quickly in February, lifting emerging market aggregates (Chart 1, panel b).
Chart 1
Purchasing Managers’ Index output by sector across advanced and emerging market economies
a) Advanced economies (excluding the euro area)
(diffusion indices)
b) Emerging market economies
(diffusion indices)
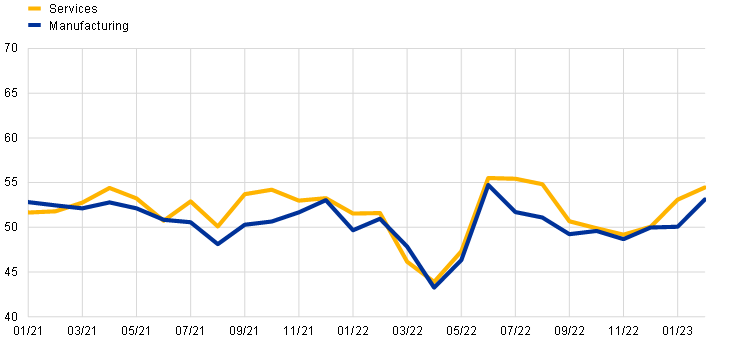
Sources: S&P Global Market Intelligence and ECB staff calculations.
Note: The latest observations are for February 2023.
The global growth outlook has been revised upwards for 2023 and 2024. While the economic reopening in China will support global growth in 2023, world economic activity remains sluggish, with growth rates over the projection horizon still below historical averages. According to the March 2023 projections, global real GDP growth is projected to be 3.0% in 2023, slightly below the growth rate of 3.3% estimated for 2022, before increasing very gradually to 3.2% in 2024 and 3.3% in 2025. Compared with the December 2022 projections, this represents upward revisions for 2023 (by 0.4 percentage points) and 2024 (by 0.1 percentage points), but no change for 2025. A key factor behind the revisions is the improved outlook in China, with the pandemic-related disruptions seen at the turn of the year expected to pave the way for a faster recovery later in 2023, given that the Chinese economy will be less constrained by the risk of renewed lockdowns. Real GDP growth in the United States has also been revised upwards against the backdrop of continued labour market resilience. For advanced economies, the projected path of real GDP growth remains relatively subdued for 2023, broadly in line with the December 2022 projections, and is expected to recover only gradually thereafter. For emerging market economies, broadly stable growth rates of around 4% are projected over the projection horizon as a whole.
World trade projections have also been revised upwards to reflect China’s economic reopening and the further easing of global supply chain constraints. This comes after negative growth in the fourth quarter of 2022, when world trade is estimated to have declined owing to weaker trade in goods across advanced and emerging market economies. Since then, there have been tentative signs of stabilisation at a low level. Although the global PMI new exports orders index for manufacturing remains in contractionary territory, it improved in both January and February 2023. In addition, global supply constraints have eased significantly and suppliers’ delivery times have shortened, suggesting that the impact of pandemic-related disruptions in China on global supply chains was relatively limited and short-lived (Chart 2). The expectation in the March 2023 projections is for world trade growth to be less dynamic than global real GDP growth this year, reflecting the continued diminishing impact of the unwinding of supply bottlenecks that contributed to strong trade growth in 2022. As consumption patterns, especially in advanced economies, normalise and rotate back to services and away from goods, global trade might be negatively affected. World trade is projected to grow by 2.5% in 2023 – a relatively subdued pace compared with historical averages – and to increase by 3.4% in 2024 and in 2025, broadly in line with global real GDP growth. Euro area foreign demand is expected to follow a similar path. The March 2023 projections point to euro area foreign demand increasing by 2.1% in 2023, before rising to 3.1% in 2024 and 3.3% in 2025. The projections for both world trade and euro area foreign demand have been revised upwards for 2023, owing in part to stronger than anticipated outturns in the third quarter of 2022 that resulted in sizeable statistical carry-over effects.
Chart 2
Purchasing Managers’ Index suppliers’ delivery times
(index)
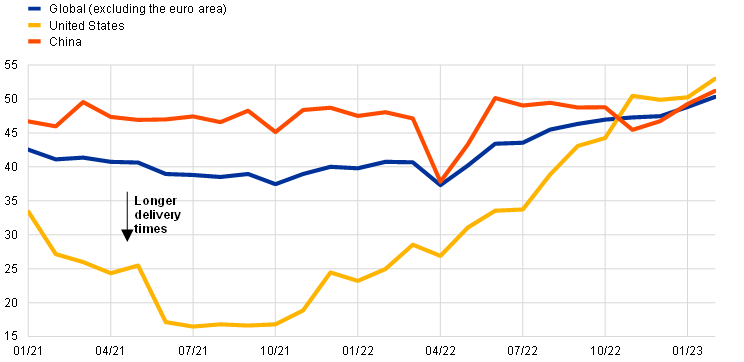
Sources: S&P Global Market Intelligence and ECB staff calculations.
Note: The latest observations are for February 2023.
Price pressures in the global economy remain high. Global CPI inflation has been declining since it peaked in summer 2022, owing to waning supply disruptions, falling energy prices and synchronised monetary policy tightening. However, resilient labour markets and strong wage growth, especially in advanced economies, suggest that underlying inflationary pressures are strong. Annual headline CPI inflation across the member countries of the Organisation for Economic Co-operation and Development (OECD) decreased slightly to 9.2% in January 2023, down from 9.4% in the previous month. Inflation momentum for headline CPI inflation is declining sharply owing to falling energy prices (Chart 3, panel a). By contrast, core CPI inflation (which excludes food and energy components) remained unchanged at 7.2% over the same period, and, although its momentum has slowed somewhat, it remains relatively strong, suggesting more persistent inflationary pressures (Chart 3, panel b). The projected path of euro area competitor export prices also reflects this narrative and has been revised slightly downwards compared with the December 2022 projections.
Chart 3
Consumer price index inflation in the OECD area
a) Headline
(year-on-year percentage changes and three-month-on-three-month annualised percentage changes)
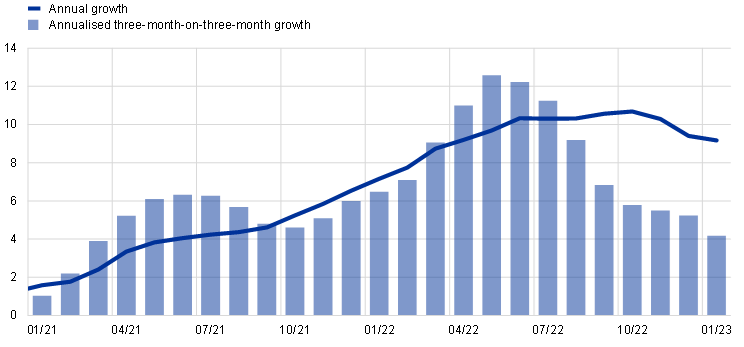
b) Core
(year-on-year percentage changes and three-month-on-three-month annualised percentage changes)
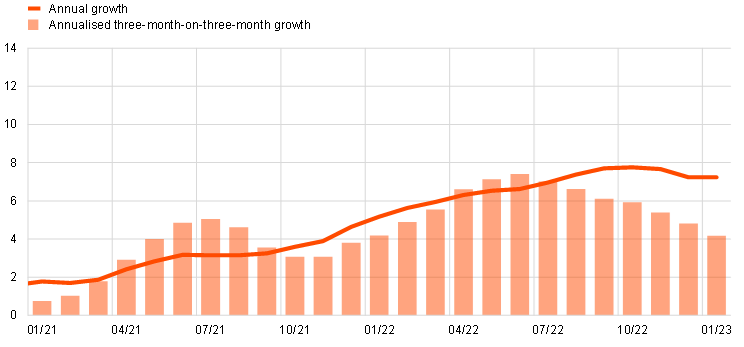
Sources: OECD and ECB calculations.
Notes: Core CPI inflation excludes energy and food components. The patterns of annual headline and core CPI inflation, and their respective inflation momentums, would be similar even if Türkiye (where inflation remains in high double digits) were to be excluded from the OECD aggregate. In January 2023 annual headline and core CPI inflation for OECD countries excluding Türkiye (not shown in the panels) stood at 7.5% and 5.7% respectively, compared with 7.6% and 5.6% in December 2022. The latest observations are for January 2023.
Global oil prices have declined, and European gas prices have fallen sharply but remain well above levels before the Russia-Ukraine war. A successful substitution of gas imports from Russia with liquified natural gas imports over the course of 2022 helped to build up gas inventories in Europe ahead of the winter. Their levels have also remained high, owing to lower demand as a result of a very mild winter and effective gas-saving measures. Furthermore, the current high gas inventory levels leave Europe in a better position ahead of next winter compared with last year. However, upside risks to gas prices remain, owing to the possibility of (i) Chinese demand for liquified natural gas imports being stronger than currently expected, and (ii) Russia cutting the remaining gas supplies to Europe later this year. With regard to oil, the drop in prices reflects weaker global demand and growing concerns about future oil demand in the wake of the financial market tensions emanating from the US banking sector. It also reflects the thus far relatively limited effect on global oil supplies of the latest sanctions imposed on Russia, which has only been partly offset by the impact of China’s economic reopening. Furthermore, global oil supplies have been bolstered by higher production in Kazakhstan and Nigeria. However, upside risks to global oil prices remain given the possibility of a lower supply of oil from Russia, despite the ongoing diversion of its oil exports from Europe to China and India. In response to the sanctions, Russia announced a 5% cut in its crude oil production.
Global risk sentiment remains volatile. This volatility has increased further more recently against the backdrop of significant financial market tensions triggered by bank failures in the United States. Global financial markets, and stock market valuations in particular, were initially buoyed by the optimism generated by the reopening of the Chinese economy, moderating energy prices and early signs of easing inflationary pressures. However, their performance has been mixed more recently given signs that underlying inflationary pressures in the global economy remain strong, owing to the continuing strong performance of labour markets and high wage growth. This has led market participants to revise their expectations about monetary policy actions in major advanced economies, which is also weighing on global risk sentiment.
In the United States, economic activity is projected to slow in the first half of this year, while disinflation is likely to be more gradual than expected. Real GDP growth in the fourth quarter of 2022 increased by 0.8% in quarterly terms, driven by strong inventory investment, while domestic demand continued to cool. Recent indicators point to modest growth in consumer spending, in part reflecting tighter financial conditions over the past year. Moreover, housing sector activity continues to weaken, largely as a result of rising mortgage rates. Higher interest rates and slower output growth also appear to be weighing on business fixed investment. Looking ahead, the continuing slowdown in domestic demand points to weak growth in the first half of the year, even with moderating inflation and strong labour markets. Despite this slower growth, the labour market remains very tight, with few signs of easing, and nominal wage growth is still high, supporting the view that inflation in the United States might be more persistent than anticipated. Annual headline CPI inflation fell to 6.0% in February 2023, owing to a decline in food and energy prices, and annual core CPI inflation dropped slightly to 5.5%. While the financial market tensions triggered by bank failures could further weigh on growth in the US economy, their impact remains largely uncertain.
In China, recovery from the recent pandemic-related disruptions is well under way. Quarter-on-quarter real GDP growth remained unchanged in the fourth quarter of 2022, following the sudden decision by the authorities to abandon the dynamic zero-COVID strategy, which initially resulted in a large increase in COVID-19 infection rates. However, as that wave of infections continues to ebb, economic activity is expected to rebound already in the first quarter of 2023, and to do so more strongly from the second quarter as the pandemic-related constraints wane. This is supported by the large rise in mobility and congestion seen in major cities, although other indicators tracking economic activity, such as those relating to coal prices and air quality, have recovered more moderately thus far. Outbound Chinese tourism is reportedly also picking up. Meanwhile, the real estate sector is showing only a mild recovery. This is explained by the lingering effect on confidence around the purchase of big-ticket items generated by the pandemic and by continued negative perceptions of the viability of private real estate developers. Against this backdrop, the growth outlook for China has been revised upwards for 2023 and is expected to reach average growth rates similar to the “at around 5%” target recently announced by the Government. Inflationary pressures in China remain moderate and are not expected to increase significantly as the economy reopens.
In Japan, real GDP growth was flat in the fourth quarter of 2022 amid relatively weak domestic demand. This outturn was weaker than expected, with a more dynamic recovery having generally been expected given that growth had contracted in the third quarter. For 2023, economic activity is projected to increase gradually, supported by pent-up demand, China’s economic reopening and continued monetary and fiscal support. In January, annual headline CPI inflation rose to 4.3%. In the near term, inflation is expected to moderate, owing to favourable base effects from last year’s higher energy and food prices, and to the extension of the Government’s energy subsidies.
In the United Kingdom, economic activity is expected to remain weak in the first half of 2023. After the economy had narrowly avoided a technical recession late last year, growth momentum at the turn of the year was negative. This, together with weak readings for short-term indicators, suggests that growth could turn negative again in the first quarter, given that those indicators point to prolonged weakness in growth momentum and that households continue to be faced with falling real wages and tighter financial conditions. In January annual headline CPI inflation declined to 10.1%, reflecting lower fuel prices, and core inflation showed the first signs of easing thanks to lower inflation for hospitality services. However, given that the labour market remains tight and wages are increasing strongly, inflationary pressures are also expected to be more persistent in the UK economy, despite a weak growth performance.
2 Economic activity
In 2022 euro area real GDP grew by 3.5% and by the end of the year was 2.4% above its pre-pandemic level. However, this outcome masked a significant slowdown in activity in the second half of 2022, reflecting the fading effect of factors that had supported the economy earlier in the year, notably the strong rebound in demand for contact-intensive services after the easing of COVID-19-related restrictions. In addition, soaring energy prices had a negative impact on spending and production. Economic activity in the euro area stagnated in the last quarter of 2022 as a result of offsetting factors. While net trade had a large positive impact on growth, all private domestic demand components contracted amid declining real disposable income, lingering uncertainty and tighter financing conditions. The euro area economy is expected to start on a gradual recovery path in early 2023 as incoming survey data point to some uptick in activity and confidence. More secure energy supplies, significantly lower energy prices, the easing of supply chain issues and government support should continue to provide some relief for households and industries in the coming quarters. Over the medium term a robust labour market, improving confidence and a recovery in real incomes should support a rebound in euro area GDP growth, but the gradual tightening of financing conditions is expected to have a dampening effect on activity.
This assessment is broadly reflected in the baseline scenario of the March 2023 ECB staff macroeconomic projections for the euro area. Annual real GDP growth is expected to slow to 1.0% in 2023 before rebounding to 1.6% in 2024 and 2025. Compared with the December 2022 Eurosystem staff macroeconomic projections for the euro area, the outlook has been revised up by 0.5 percentage points in 2023 and revised down by 0.3 percentage points in 2024 and 0.2 percentage points in 2025. Given that the projections were finalised in early March before the recent emergence of financial market tensions, this outlook is surrounded by additional uncertainty.
Euro area activity stagnated in the fourth quarter of 2022. The expenditure breakdown shows a strong negative contribution from domestic demand, with both private consumption and investment seeing a marked decline (Chart 4). However, this was offset by a positive contribution from net trade due to sluggish exports and declining imports. While the dynamics of investment and imports in the last quarter of 2022 were affected by volatile developments in Ireland, the contraction in private domestic demand suggests very weak underlying growth dynamics at the end of the year. This last quarterly outcome brought euro area annual real GDP growth to 3.5% in 2022, with a carry-over to growth in 2023 estimated at 0.4%, slightly below the historical average.
Chart 4
Euro area real GDP and its components
(quarter-on-quarter percentage changes; percentage point contributions)
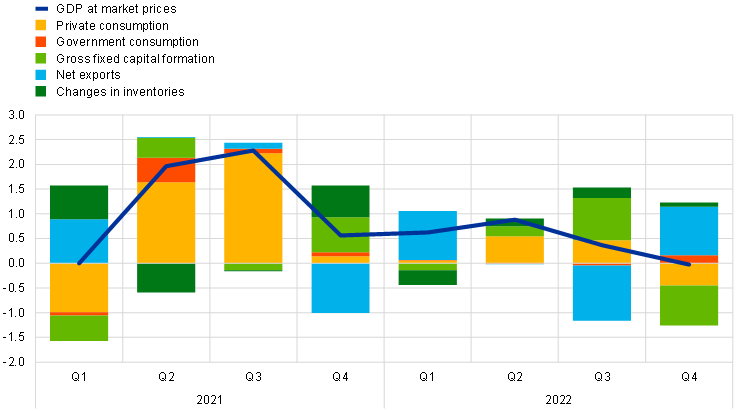
Sources: Eurostat and ECB calculations.
Note: The latest observations are for the fourth quarter of 2022.
Euro area GDP growth is expected to turn slightly positive in the first quarter of 2023, with mixed signals from the most recent economic indicators. Incoming survey data suggest that the euro area economy may have expanded modestly in the first quarter of the year. The composite output Purchasing Managers’ Index (PMI) for the euro area increased further in February to reach a nine-month high and is now broadly in line with its long-run average. This upturn was driven mostly by business activity in the services sector (Chart 5, panel a). The persistently strong activity in contact-intensive services in early 2023 points to some lingering effects from the reopening of the economy. The manufacturing output index rose above 50 in February, signalling growth for the first time since May 2022. The manufacturing industry benefited from an easing of supply chain issues, as reflected in the strong decrease in the suppliers’ delivery times indicator in February. Nevertheless, weak demand conditions continued to weigh on manufacturing production, which recently has been mostly relying on the backlog of orders.
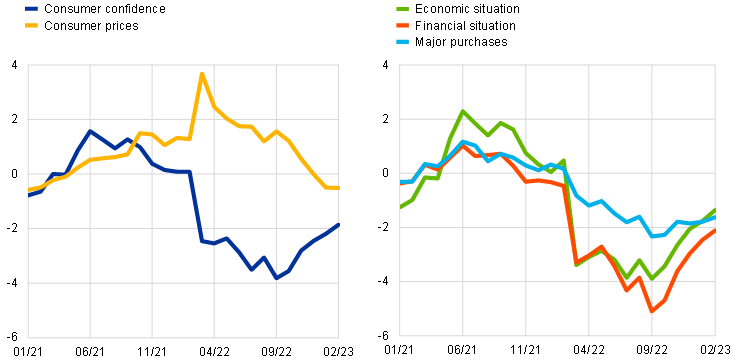
Both the manufacturing and services sectors appear to have been supported by a continued improvement in confidence in early 2023, but it is unclear to what extent the recent financial market tensions may dampen confidence in the future. The European Commission’s Economic Sentiment Indicator remained broadly stable in February following a notable improvement in January but is still at a historically low level. Moreover, its stability masks some reversal in sentiment for industry and services compensated only by improved confidence in the construction and retail sectors (Chart 5, panel b). Consumer confidence continued its recovery in February, rising for the fourth consecutive month, although the index remains well below its long-term average and below the level reached prior to the war in Ukraine. Survey results also show that in recent months households have started to be less concerned about high energy prices and uncertainty about their financial situation has declined. This is providing signs of a gradual recovery in consumer spending despite the likely adverse impact of still high inflation and rising interest rates and possibly of the recent financial market tensions.
Chart 5
Survey-based indicators across sectors of the economy
(left-hand panel: percentage balances; right-hand panel: percentage balances, February 2020=100)
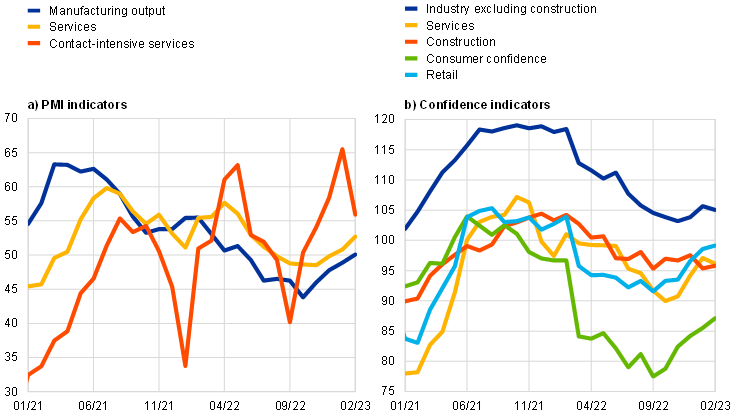
Sources: S&P Global, European Commission and ECB calculations.
Note: The latest observations are for January 2023 for contact-intensive services and February 2023 for all other items.
The labour market continued to expand in the fourth quarter of 2022 and remained resilient to the stagnation in GDP growth. Employment increased by 0.3% in the fourth quarter of 2022 and total hours worked increased by 0.4%. Since the fourth quarter of 2019 employment has increased by 2.3% and total hours worked have risen by 0.6% (Chart 6). This represents a 1.7% decline in average hours worked. Part of this decline is related to the strong employment creation in the public sector since the fourth quarter of 2019, which on average exhibits lower average hours worked compared with the total economy. The labour force has grown significantly compared with the fourth quarter of 2019. The unemployment rate was 6.6% in January and has remained broadly stable since April 2022. Labour demand remains strong, with the job vacancy rate stable at 3.2%, the highest level since the start of the series and one percentage point higher than in the fourth quarter of 2019.
Chart 6
Euro area employment, the PMI assessment of employment and the unemployment rate
(left-hand scale: quarter-on-quarter percentage changes, diffusion index; right-hand scale: percentages of the labour force)
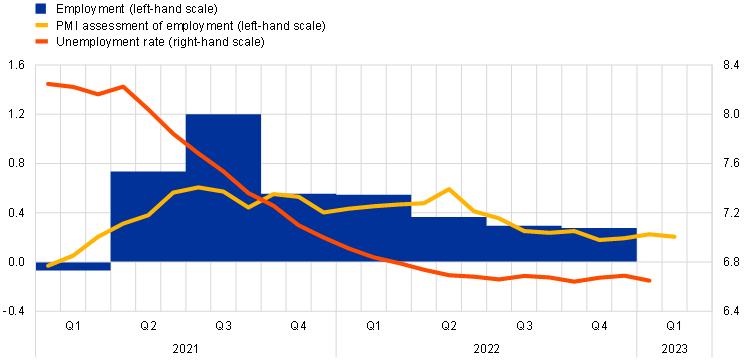
Sources: Eurostat, S&P Global Market Intelligence and ECB calculations.
Notes: The two lines indicate monthly developments, while the bars show quarterly data. The PMI is expressed in terms of the deviation from 50 divided by 10. The latest observations are for the fourth quarter of 2022 for employment, February 2023 for the PMI assessment of employment and January 2023 for the unemployment rate.
Short-term labour market indicators point to continued employment growth in the first quarter of 2023. The monthly composite PMI employment indicator declined from 52.3 in January to 52.0 in February, remaining above the threshold of 50 that indicates an expansion in employment. This indicator has been in expansionary territory since February 2021 but has fallen significantly since May 2022, suggesting decelerating employment growth. Looking at developments across different sectors, the indicator points to continued employment growth in the industry and services sectors and to broad stabilisation in the construction sector.
Private consumption contracted in the fourth quarter of last year, driven by declining real disposable income and lingering uncertainty. Despite the favourable effects of a still resilient labour market and fiscal support, elevated inflation weighed on real disposable income in the last quarter of 2022. Against this background, after three quarters of positive dynamics, private consumption contracted by 0.9% in the last quarter of 2022, reflecting divergent developments in individual components. Consumption of non-durable goods contracted sharply at the end of last year, reflecting developments in retail sales (‑1.1%, quarter-on-quarter, in the fourth quarter of 2022). Spending on services declined marginally, still benefiting somewhat from lingering reopening effects. By contrast, consumption of durable goods continued to increase for the second quarter in a row, benefiting from easing supply disruptions in the vehicle sector and government incentives for the purchase of all-electric or plug-in hybrid vehicles in Germany. Mirroring this, new passenger car registrations increased by 8.0% in the fourth quarter of last year but fell back by 7.1% month-on-month in January owing to the expiration of these incentives. Despite persistent headwinds, incoming data provide some signs of a gradual recovery in consumer spending in the first half of 2023. Retail sales increased by 0.3% month-on-month in January and households have revised down their inflation expectations in recent months (Chart 7, left-hand panel), while uncertainty about their financial situation has declined. The European Commission’s consumer confidence indicator continued to recover in February supported mainly by improving expectations about the general economic outlook and households’ own financial situation (Chart 7, right-hand panel). The Commission’s latest consumer and business surveys also indicate that expected demand for accommodation, food and travel services increased further in February alongside persistent improvements in retailers’ forward-looking demand expectations. The use of savings should also help to smooth out consumption to some extent in the face of weak real disposable income, despite the opportunity cost of holding money amid rising interest rates and the ongoing tightening of household loan conditions.
Chart 7
Household expectations
(standardised percentage balances)
Sources: European Commission (Directorate General for Economic and Financial Affairs) and ECB calculations.
Notes: The latest observations are for February 2023.
Business investment contracted in the fourth quarter of 2022 and is expected to remain weak in the first half of 2023. Non-construction investment (the closest proxy for business investment in the national accounts) fell strongly in the final quarter of 2022 – by 5.8% quarter-on-quarter – after an upward revision to its growth of 8.4% in the third quarter. However, most of the strong volatility observed in these quarters reflects a renewed episode of erratic developments in intellectual property investment related mainly to the Irish multinational sector.[2] Excluding this volatile component, business investment contracted by 0.3% in the final quarter following growth of 1.9% in the third quarter. The fourth quarter decline was driven by a marked contraction in the machinery and equipment sector, where investment in both transport and non-transport machinery and equipment fell abruptly. Incoming data for the first quarter of 2023 suggest ongoing weakness in business investment over the coming months given the high remaining uncertainty, sluggish orders and rising financing costs. The PMI output indicator for the capital goods sector bounced back into growth territory in February, bringing the quarterly average above the theoretical no-growth threshold for the first time since the second quarter of 2022, while outstanding business in the sector looks also to have improved following a sharp decline in the last quarter of 2022. However, the same source suggests new orders in the sector remain in negative territory, while capacity utilisation has been falling strongly since the summer. The Commission’s industrial confidence indicator for the capital goods sector for February 2023 remained around a full standard deviation below the level it had reached prior to the Russian invasion of Ukraine, while the broader, investor-based Sentix overall economic index also remains well below its long-term average. Together with steeply increasing financing costs, these continuing mixed signals suggest business investment can be expected to remain weak in the coming quarters.
Housing investment declined significantly in the fourth quarter of 2022 and is expected to contract further in the near term. Housing investment declined by 1.6% in the fourth quarter following a 1.1% quarter-on-quarter drop in the third quarter. Building construction output was largely unchanged on average in the fourth quarter, but fell sharply in December, suggesting a weak starting point for the first quarter of 2023. Moreover, the Commission’s indicator of construction activity over the past three months declined markedly on average in January and February compared with the fourth quarter average. In addition, despite some improvement, the PMI for residential construction remained in contractionary territory. Supply constraints appear to be gradually easing further. According to the Commission’s monthly survey of limits to production for the construction sector, the share of construction firms pointing to material and/or equipment shortages continued to decline on average in January and February, as did the percentage of those indicating labour shortages, which nevertheless remained at a high level. However, the share of managers specifying insufficient demand as a factor limiting their building activity rose again compared with the fourth quarter average, indicating weakening demand. This information is in line with the low levels of the new orders component of the construction PMI, although households’ short-term intentions to renovate, buy or build a home have stabilised. Overall, housing demand is likely to weaken further against a backdrop of a significant deterioration in financing conditions and significantly increased construction costs, thus further depressing housing investment in the future.
Euro area export volumes growth continued to be sluggish around the turn of the year due to subdued global foreign demand. Initial estimates point to modest growth in real goods exports on a quarter-on-quarter basis in December, as global foreign demand weakened. At the same time, monthly data point to a sharp drop in production for energy-intensive sectors (such as chemicals), suggesting that despite recent energy price reductions, the effects of still high energy costs continue to weigh on the prospects for production and exports. With import volumes contracting, net trade contributed positively to GDP growth in the fourth quarter. Falling energy prices were also behind a further improvement in the euro area terms of trade, which contributed to a sharp recovery in the current account in the fourth quarter of 2022. Forward-looking indicators point to continued near-term weakness in euro area export volumes. At the same time, supplier delivery times shortened in February, which should ease the headwinds for euro area trade.[3] China’s reopening should also support euro area exports in goods and services, including tourism, but the overall impact for euro area activity is expected to be modest. The PMI for new orders in the tourism sector rebounded strongly in January and February.
Beyond the near term, GDP growth is expected to gradually strengthen as uncertainty recedes and real incomes increase, despite tightening financing conditions. More secure energy supplies, significantly lower energy prices, the easing of supply chain issues and government support should continue to provide some relief for households and energy-intensive industries in the coming quarters. Industrial production should pick up as supply conditions improve further, confidence continues to recover and firms work off large order backlogs. Rising wages and falling energy prices should partly offset the loss of purchasing power that many households are experiencing as a result of high inflation. This, in turn, should support consumer spending. Over the medium term, a robust labour market, improving confidence and a recovery in real incomes should support a rebound in euro area GDP growth, but the gradual tightening of financing conditions is expected to have a dampening effect on activity.
The March 2023 ECB staff macroeconomic projections for the euro area foresee annual real GDP growth to slow to 1.0% in 2023 before rebounding to 1.6% in 2024 and 2025 (Chart 8). Compared with the December 2022 Eurosystem staff macroeconomic projections, real GDP growth has been revised up by 0.5 percentage points for 2023 and revised down by 0.3 percentage points for 2024 and by 0.2 percentage points for 2025. As the projections were finalised in early March before the recent emergence of financial market tensions, this outlook is surrounded by additional uncertainty.
Chart 8
Euro area real GDP (including projections)
(index: fourth quarter of 2019 = 100; seasonally and working day-adjusted quarterly data)
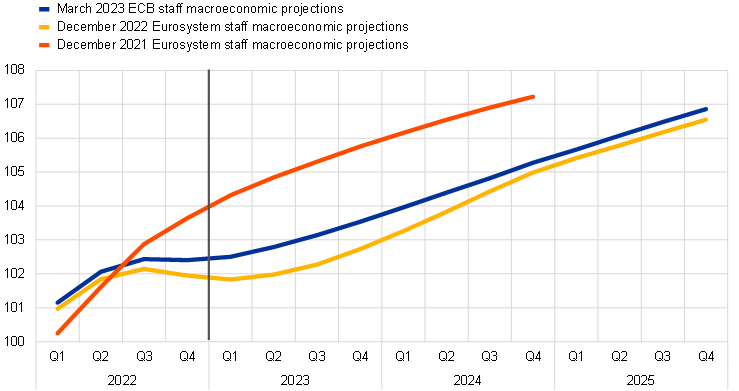
Sources: Eurostat and March 2023 ECB staff macroeconomic projections for the euro area.
Note: The vertical line indicates the start of the March 2023 ECB staff macroeconomic projections for the euro area.
3 Prices and costs
According to Eurostat’s flash estimate, inflation in the euro area edged down to 8.5% in February, primarily reflecting a renewed sharp drop in energy prices. However, food price inflation and HICP inflation excluding energy and food rose further, with the past surge in the cost of energy and of other inputs, as well as the impacts of supply bottlenecks and of the reopening the economy, still feeding through to consumer prices with a delay. Headline inflation is expected to average 5.3% in 2023, according to the March 2023 ECB staff macroeconomic projections for the euro area, largely reflecting downward energy-related base effects, declines in energy prices and easing pipeline pressures.[4] Over the rest of the projection horizon, it is expected to decline further to 2.9% in 2024 and 2.1% in 2025. Inflation excluding energy and food is expected to stand at 4.6% in 2023, which is higher than foreseen in the December 2022 Eurosystem staff macroeconomic projections for the euro area. Subsequently, it is projected to come down to 2.5% in 2024 and 2.2% in 2025. Wage pressures have strengthened, and most measures of longer-term inflation expectations currently stand at around 2.0%, although they warrant continued monitoring, especially considering the recent volatility in market-based inflation expectations.
According to the Eurostat flash estimate, inflation as measured by the HICP decreased further to 8.5% in February, down slightly from 8.6% in January 2023. The decrease was driven by the annual rate of change in energy prices (13.7% in February, down from 18.9% in January), while the inflation rates for all the other components increased. The further increase in food inflation to 15% in February, up from 14.1% in January, reflected a further strengthening in the annual inflation rate for both processed and unprocessed food, but particularly for the latter. The strong food price dynamics continue to reflect the lagged effects of past increases in global food commodity prices and energy-related costs from mid-2021. However, the moderation of indicators such as euro area farm gate prices points to the possible normalisation of food inflation looking ahead (Chart 9).
Chart 9
Energy and food input cost pressure
(annual percentage changes)
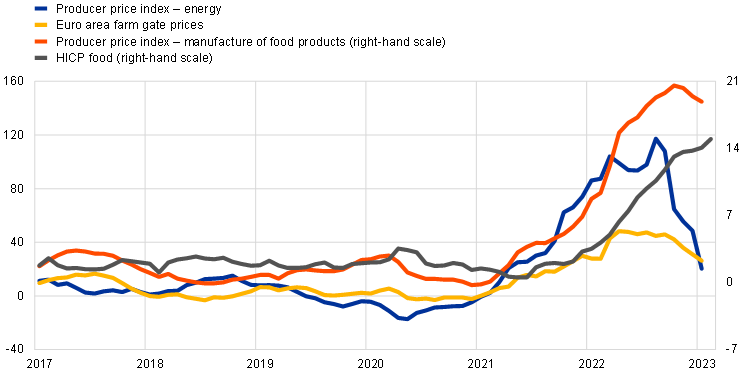
Source: Eurostat.
Notes: HICP stands for Harmonised Index of Consumer Prices. The latest observations are for February 2023 (flash estimate) for HICP food and January 2023 for the remaining items.
HICP inflation excluding energy and food (HICPX) increased further to 5.6% in February, up from 5.3% in January, driven by non-energy industrial goods (NEIG) and services inflation (Chart 10). The ongoing strength and the further increase in NEIG inflation continue to reflect the accumulated pipeline pressures from past supply bottlenecks and high energy costs. Services inflation rose strongly to 4.8% in February from 4.4% in January, with prices for contact-intensive sectors such as package holidays likely remaining a key driver. This is in line with demand pressures after the reopening of the economy, but as most of these services are also energy intensive, the surge in energy prices since mid-2021 is likely to have created additional upward cost pressures that are still feeding through.
Chart 10
Headline inflation and its main components
(annual percentage changes; percentage point contributions)
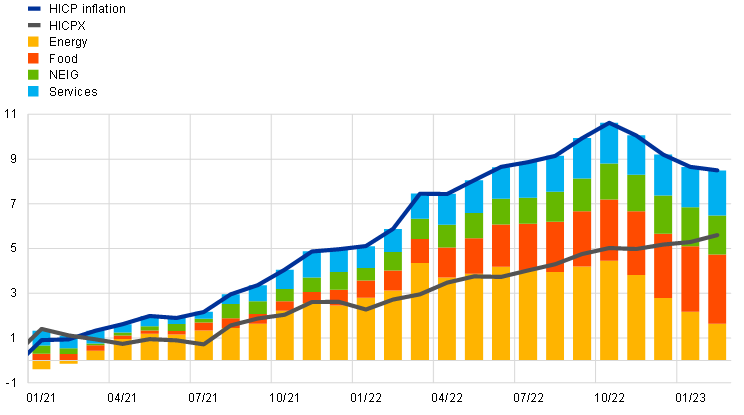
Sources: Eurostat and ECB calculations.
Notes: HICP stands for Harmonised Index of Consumer Prices. HICPX stands for HICP inflation excluding energy and food. NEIG stands for non-energy industrial goods. The latest observations are for February 2023 (flash estimate).
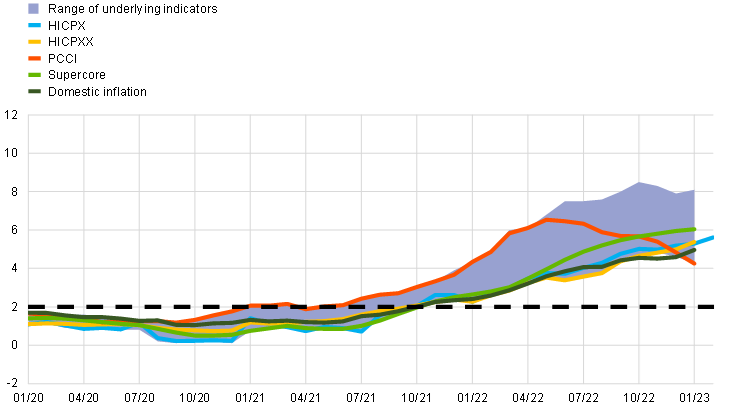
Measures of underlying inflation remained at elevated levels and continued to give mixed signals (Chart 11).[5] While HICPX inflation increased further in February, other indicators of underlying inflation, which are currently only available up to January 2023, gave mixed signals. The Supercore indicator, which comprises HICP items sensitive to the business cycle, and the domestic inflation indicator, which comprises HICP items with a lower import content, continued to increase up to January. By contrast, the rate of change for the model-based Persistent and Common Component of Inflation (PCCI) (both including and excluding energy items) declined over the last few months leading up to January. This downward movement is in line with indications of a slowing momentum in HICPX dynamics, with three-month-on-three-month changes since November 2022 being lower than in previous months.
Chart 11
Indicators of underlying inflation
(annual percentage changes)
Sources: Eurostat and ECB calculations.
Notes: The range of indicators of underlying inflation includes HICP excluding energy and unprocessed food, HICPX (HICP excluding energy and food), HICPXX (HICP excluding energy, food, travel-related items, clothing and footwear), the 10% and 30% trimmed means, the PCCI (Persistent and Common Component of Inflation) and the Supercore. The latest observations are for February 2023 (flash estimate) for the HICPX and January 2023 for the remaining items.
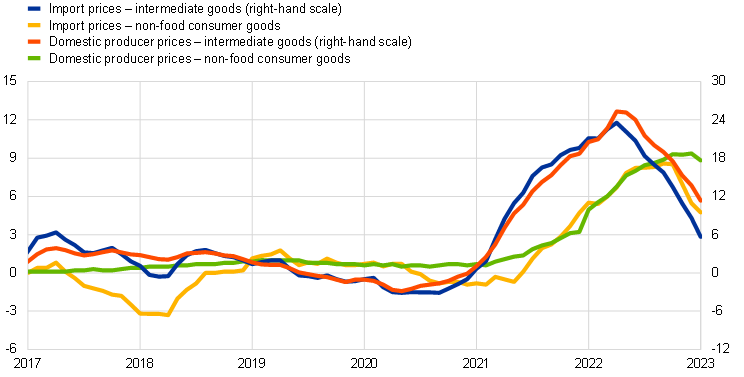
Pipeline pressures for consumer goods inflation remained strong, despite some easing in the pricing chain (Chart 12). Accumulated pipeline pressures from supply bottlenecks and high energy prices are still having an effect, underpinning the continued high NEIG inflation rate of 6.8% in February 2023, up from 6.7% in the previous month. Data for producer prices in January 2023 showed that pipeline pressures were still strong, particularly at the later stages of the pricing chain. At the same time, the annual growth rate of producer prices for domestic sales of non-food consumer goods fell to 8.8% in January 2023 from 9.4% in December 2022, showing tentative signs of easing. The growth in import prices for non-food consumer goods continued to slow, helped by the euro exchange rate appreciation, standing at 4.7% in January 2023, down from 5.5% in the previous month. The decrease in the annual growth rate of import prices and producer prices for intermediate goods was stronger over the same period, down from 8.6% to 5.6% and from 13.7% to 11.3% respectively. This points to some easing of pressure along the pricing chain.
Chart 12
Indicators of pipeline pressures
(annual percentage changes)
Sources: Eurostat and ECB calculations.
Note: The latest observations are for January 2023.
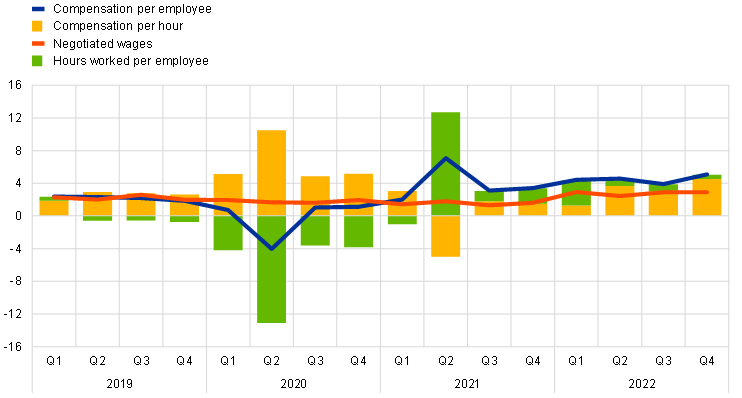
Wage dynamics strengthened at the end of 2022. While negotiated wage growth gradually inched up to 3.0% in the fourth quarter of 2022, actual wage growth as measured by compensation per employee and compensation per hour strengthened considerably (Chart 13). National accounts show that compensation per employee year-on-year growth in the euro area rose to 5.1% in the fourth quarter of 2022 (up from 3.9% in the previous quarter), largely driven by higher growth in the non-market services sector. Growth in compensation per hour also edged upwards in the fourth quarter of 2022, reaching 4.5% year on year, up from 3.0% in the previous quarter. The high consumer inflation rates observed at the end of 2022 imply that, in real terms, average wages per employee and per hour continued to decline in the fourth quarter of 2022. Information from wage negotiations concluded in late 2022 and early 2023 suggest that the strengthened nominal wage growth is set to continue.
Chart 13
Breakdown of compensation per employee into compensation per hour and hours worked per employee
(annual percentage changes)
Sources: Eurostat and ECB calculations.
Note: The latest observations are for the fourth quarter of 2022.
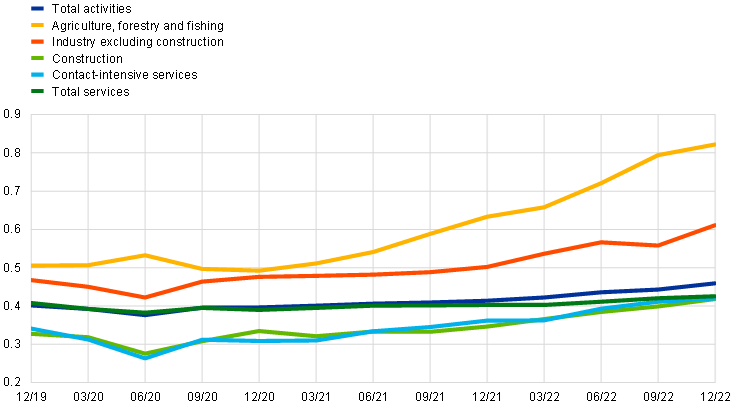
Domestic price pressures continued to increase on account of both labour costs and profit margin developments. The year-on-year growth rate of the GDP deflator rose to 5.8% in the fourth quarter of 2022, up from 4.6% in the previous quarter, driven by both labour costs and profits. Growth in unit labour costs increased from 3.2% to 4.7% between the third and fourth quarters of 2022, while year-on-year growth in unit profits (as measured by gross operating surplus) surged from 7.4% to 9.4%. Overall, unit profits accounted for more than half of the growth in domestic cost pressures in the fourth quarter of 2022. The environment of supply/demand imbalances in many sectors, high input price pressures and generally high inflation appears to have facilitated increases in profit margins that go beyond pure recuperation of input costs. Strong developments in unit profits, with some heterogeneities, are visible across all main economic sectors in 2022 and, by contrast with the pandemic period, have also become more visible in contact-intensive services sectors (Chart 14).
Chart 14
Sectoral unit profit developments
(gross operating surplus over real value added, levels)
Sources: Eurostat and ECB calculations.
Notes: For each sector, unit profits are computed as gross operating surplus over real gross value added. Gross operating surplus is estimated as nominal gross value added minus compensation of employees. Compensation of employees includes labour income for the self-employed, assuming that the per capita labour compensation of the self-employed is the same as that of employees.
Contact-intensive services include trade, transport, accommodation and food as well as arts, entertainment, recreation and other services. The latest observations are for the fourth quarter of 2022.
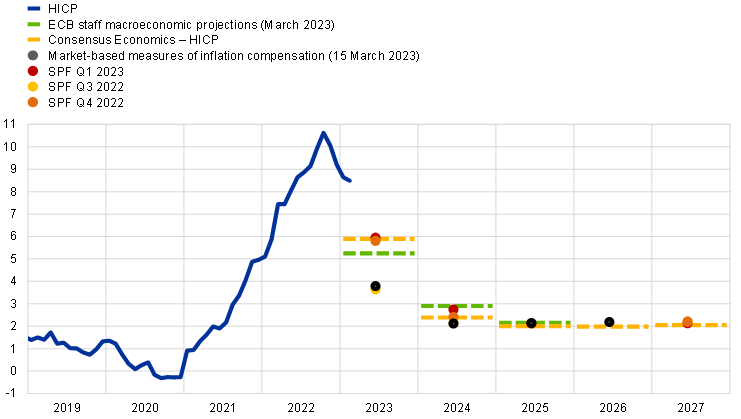
Survey and market-based evidence shows that forecasters continue to expect inflation to decline, with longer-term expectations remaining at around the ECB’s 2.0% target (Chart 15). In the ECB’s most recent Survey of Professional Forecasters (SPF) in January 2023, inflation expectations for 2023 were revised slightly upwards by 0.14 percentage points to 5.9%. Long-term inflation expectations for 2027 in this survey were slightly lower at 2.1% (down from 2.2%) for the HICP and 2.0% (down from 2.1%) for the HICPX. The median long-term inflation expectations for 2026 set out in the February 2023 ECB Survey of Monetary Analysts remained unchanged at 2.0%, in line with recent rounds of other surveys (2.0% for 2027 in the February 2023 Consensus Economics survey). According to the latest ECB Consumer Expectations Survey (January 2023), the mean/median inflation expectations for three years ahead fell substantially to 3.8%/2.5%, from 4.6%/3.0% in the previous round. The market-based measures of inflation compensation (based on HICP excluding tobacco) on 15 March 2023 suggest that euro area inflation will decline in 2023 to stand at 3.8% in December 2023. Over the course of 2024, market-based measures of inflation compensation suggest that inflation will move closer to 2.0%. Longer-term measures of inflation compensation increased moderately over the review period, with the five-year forward inflation-linked swap rate five years ahead standing at 2.35% on 15 March 2023. Importantly, however, market-based measures of inflation compensation are not a direct measure of market participants’ actual inflation expectations since they contain inflation risk premia to compensate for inflation uncertainty. By contrast, survey-based measures of long-term inflation expectations, which are free of inflation risk premia, have been relatively stable at around 2.0%. This relative stability suggests that the current volatility in long-term market-based measures predominantly reflects variations in inflation risk premia.
Chart 15
Survey-based indicators of inflation expectations and market-based indicators of inflation compensation
(annual percentage changes)
Sources: Eurostat, Refinitiv, Consensus Economics, Survey of Professional Forecasters (first quarter of 2023), ECB staff macroeconomic projections for the euro area (March 2023) and ECB calculations.
Notes: HICP stands for Harmonised Index of Consumer Prices. SPF stands for Survey of Professional Forecasters. The market-based indicators of inflation compensation series are based on the one-year spot inflation rate, the one-year forward rate one year ahead, the one-year forward rate two years ahead, the one-year forward rate three years ahead and the one-year forward rate four years ahead. Due to indexation lag, the latest available one-year spot inflation rate indicates the inflation compensation between December 2022 and December 2023. The forward inflation rates also indicate the inflation rate in December compared with the previous year. The latest observations for the HICP was for February 2023 (flash estimate). The March 2023 ECB staff macroeconomic projections for the euro area were finalised in early March and the cut-off date for the technical assumptions was 15 February 2023. The cut-off date for the Consensus Economics long-term forecasts was January 2023. The latest observations for market-based indicators of inflation compensation are for 15 March 2023. The SPF for the first quarter of 2023 was conducted between 6 and 12 January 2023.
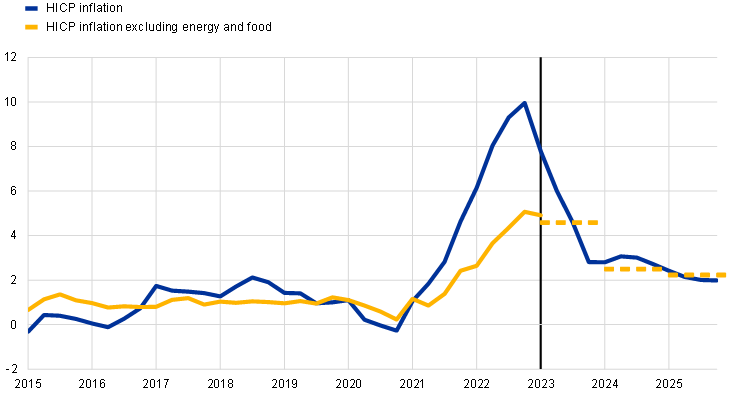
The March 2023 ECB staff macroeconomic projections for the euro area envisage headline inflation remaining high in the near term, averaging 5.3% in 2023, before decreasing to 2.9% in 2024 and 2.1% in 2025 (Chart 16). Headline inflation is expected to fall significantly over the course of 2023, driven by downward energy-related base effects, declines in energy prices and easing pipeline pressures. The baseline projection sees headline inflation declining from 10.0% in the fourth quarter of 2022 to 2.8% in the fourth quarter of 2023, to then hover around 3.0% in 2024 before reaching the ECB’s inflation target of 2.0% in the third quarter of 2025. HICPX inflation is expected to moderate as pipeline price pressures gradually ease (compounded by the recent falls in energy prices) and the tighter monetary policy is transmitted to the economy, while historically high wage growth will contribute to keeping core inflation elevated. The expected decline from 4.6% in 2023 to 2.2% in 2025 follows the unwinding of the upward impacts of supply bottlenecks and the effects of the reopening of the economy, coupled with lagged effects from the slowdown in growth and an easing of the indirect effects from the rise in energy prices. Compared with the December 2022 Eurosystem staff macroeconomic projections, headline inflation has been revised downwards for all years of the projection horizon (by 1.0 percentage point for 2023, 0.5 percentage points for 2024 and 0.2 percentage points for 2025). The large downward revision in 2023 was driven mainly by a lower path for energy inflation, while in 2024 and 2025 it also reflects a downward revision to HICPX inflation of 0.3 and 0.2 percentage points respectively.
Chart 16
Euro area HICP and HICPX inflation
(annual percentage changes)
Sources: Eurostat and ECB staff macroeconomic projections for the euro area (March 2023).
Notes: HICP stands for Harmonised Index of Consumer Prices. HICPX stands for HICP inflation excluding energy and food. The vertical line indicates the start of the projection horizon. The latest observations are for the first quarter of 2023 for the data and the fourth quarter of 2025 for the projections. The March 2023 ECB staff macroeconomic projections for the euro area were finalised in early March and the cut-off date for the technical assumptions was 15 February 2023. Historical data for HICP and HICPX inflation are at quarterly frequency. Forecast data are at quarterly frequency for HICP inflation and annual frequency for HICPX inflation.
4 Financial market developments
The review period (15 December 2022 to 15 March 2023) witnessed a highly volatile pattern in euro area financial markets and culminated in rising market tensions and heightened uncertainty, sparked by difficulties at several US regional banks and a major Swiss financial institution. Prior to these market tensions, short- and long-term interest rates were largely driven higher by market expectations of a more pronounced and long-lasting monetary policy tightening, as underlying price pressures remained strong, despite headline inflation declining. The expectations for these rate increases largely receded after market participants repriced the future path of monetary policy rates in light of rising market tensions and their ramifications for the inflation outlook. On net, over the entire review period, euro area risk-free rates and longer-term bond yields increased only slightly. The broad-based sell-off in risky assets towards the end of the review period led to a sizeable widening in high-yield corporate bond spreads and a large fall in equity prices, notably for banks. In foreign exchange markets, the euro remained broadly unchanged in trade-weighted terms during the review period.
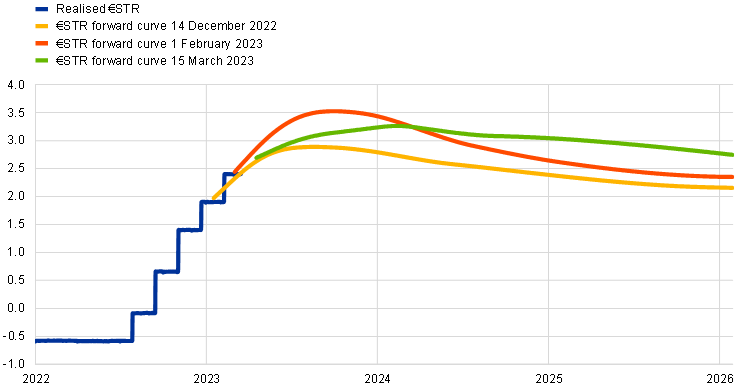
Over the review period (15 December 2022 to 15 March 2023) euro area short-term risk-free rates increased only slightly, as market expectations of a more pronounced monetary policy tightening largely receded towards the end of the review period amid rising financial market tensions. The benchmark euro short-term rate (€STR) closely followed the changes in the deposit facility rate, which the Governing Council raised by 50 basis points at its monetary policy meetings in December (from 1.5% to 2%) and February (from 2% to 2.5%). During most of the review period, the overnight index swap (OIS) forward curve, based on the €STR, increased significantly, reflecting firmer expectations of further rate hikes, driven by a more resilient growth outlook and strong underlying inflationary pressures. However, towards the end of the review period, the elevated level of uncertainty – sparked by the difficulties at several regional US-based banks and Credit Suisse – also created tension in euro area financial markets. Amid high volatility, the €STR forward curve moved significantly lower across tenors. At the end of the review period, the peak rate was priced to reach close to 3.3% in early 2024 (compared with a peak rate of 2.9% at the beginning of the review period), while pointing to a reversal as from the second quarter of 2024. Overall, the €STR forward curve moved higher across maturities during the review period.
Chart 17
(percentages per annum)
Sources: Thomson Reuters and ECB calculations.
Note: The forward curve is estimated using spot OIS (€STR) rates.
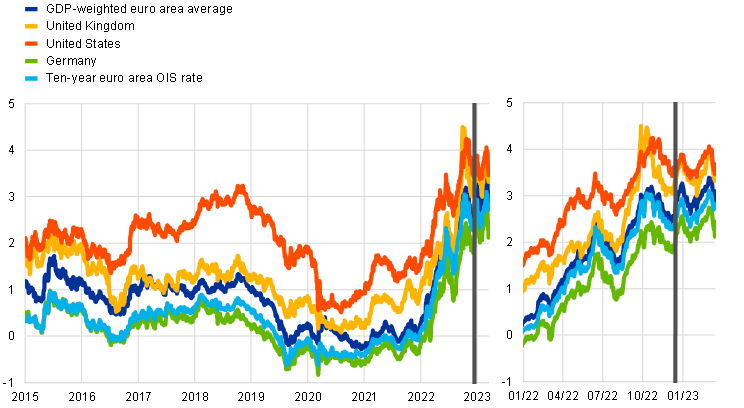
Long-term government bond yields followed the movements in risk-free rates and were also highly affected by the elevated level of uncertainty (Chart 18). Over the review period, long-term government bond yields broadly followed the development in risk-free rates and were subject to considerable volatility. Long-term bond yields remained sensitive to incoming macroeconomic news, before also being highly affected by the increased uncertainty in financial markets, triggered by difficulties at certain US banks. The ten-year GDP-weighted euro area sovereign bond yield broadly tracked the ten-year euro OIS rate for most of the period, with broadly similar movements in the US and UK ten-year sovereign bond yields. Amid intermediate swings related to macroeconomic news, the ten-year euro OIS rate and the ten-year GDP-weighted euro area sovereign bond rate increased substantially from 15 December 2022, before most of that increase was reversed amid rising market tensions at the end of the review period. The rising market tensions led to a smaller drop in the ten-year OIS rate compared with the ten-year GDP-weighted sovereign bond yield – in particular, the ten-year German sovereign bond yield showed a decline. Over the entire review period, the ten-year euro area OIS rate and ten-year GDP-weighted average sovereign yield increased by 31 and 7 basis points, reaching 2.76% and 2.84%, respectively.
Chart 18
Ten-year sovereign bond yields and the ten-year OIS rate based on the €STR
(percentages per annum)
Sources: Refinitiv and ECB calculations.
Notes: The vertical grey line denotes the start of the review period on 15 December 2022. The latest observations are for 15 March 2023.
Euro area sovereign bond yields moved broadly in line with risk-free rates for most of the review period, with sovereign spreads narrowing somewhat towards the end of the period across countries (Chart 19). While long-term risk-free rates showed sizeable fluctuations over the review period, the ten-year GDP-weighted euro area sovereign bond spread over the OIS rate remained relatively stable until the last days of the review period; as market tensions increased, European bank stocks plunged and risk sentiment among market participants dropped markedly, triggering a decline in euro area government bond yields relative to swap rates. The ten-year GDP-weighted average government bond yield ended the review period 24 basis points lower than in mid-December 2022. The decline reflected a tightening of sovereign spreads across countries. For instance, the Italian ten-year sovereign bond spread declined by 36 basis points, while the corresponding spreads for Greece and Germany declined by 28 basis points.
Chart 19
Ten-year euro area sovereign bond spreads vis-à-vis the ten-year OIS rate based on the €STR
(percentage points)
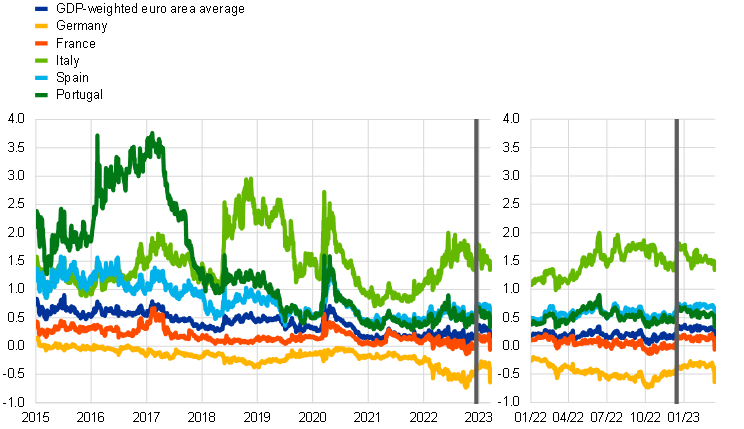
Sources: Refinitiv and ECB calculations.
Notes: The vertical grey line denotes the start of the review period on 15 December 2022. The latest observations are for 15 March 2023.
As risk sentiment declined late in the review period, high-yield corporate bond spreads increased significantly and ended the review period higher than at the start. Despite corporate bond spreads having tightened for most of the review period on the back of an improved macroeconomic outlook, the sudden drop in risk sentiment at the end of the review period meant that high-yield corporate bond spreads increased substantially and ended the review period 23 basis points higher than they started. Spreads on investment-grade corporate bonds remained broadly unchanged over the review period.
In keeping with this development, European equity prices saw a large fall amid the broad-based sell-off in risky assets towards the end of the review period. While the fall in equity prices at the end of the review period was broad-based, it was particularly severe for bank stocks. However, before the fall, euro area equity prices had been on the rise, driven mainly by the banking sector against the backdrop of a more resilient near-term growth outlook and a better than expected reporting season for earnings in the fourth quarter of 2022. Considering the entire review period, equity prices of non-financial corporations (NFCs) increased by 5.2% in the euro area and by 1.1% in the United States. For the banking sector, the index gained 8.4% in the euro area, while it lost 10.8% in the United States.
Chart 20
Euro area and US equity price indices
(index: 1 January 2015 = 100)
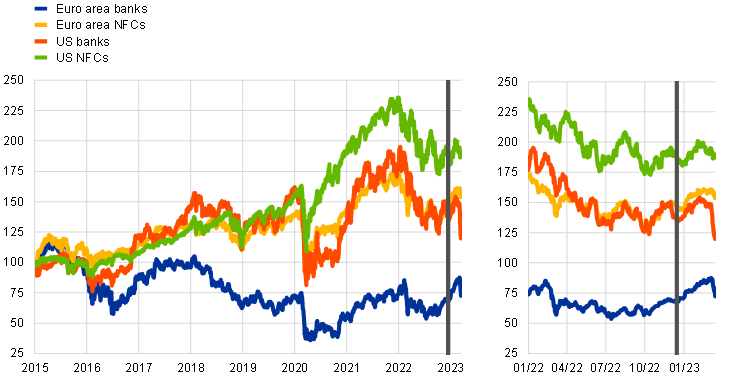
Sources: Refinitiv and ECB calculations.
Notes: The vertical grey line denotes the start of the review period on 15 December 2022. The latest observations are for 15 March 2023.
In foreign exchange markets, the euro remained broadly unchanged in trade-weighted terms (Chart 21). During the review period the nominal effective exchange rate of the euro – as measured against the currencies of 41 of the euro area’s most important trading partners – appreciated by 0.1%. In terms of bilateral exchange rate movements, the euro depreciated against most major currencies, including the US dollar (by 0.7%), the Chinese renminbi (by 1.5%), the Japanese yen (by 3.8%) and the Swiss franc (by 1.4%). At the same time, the euro strengthened against the pound sterling (by 1.2%) as well as against some other European currencies.
Chart 21
Changes in the exchange rate of the euro vis-à-vis selected currencies
(percentage changes)
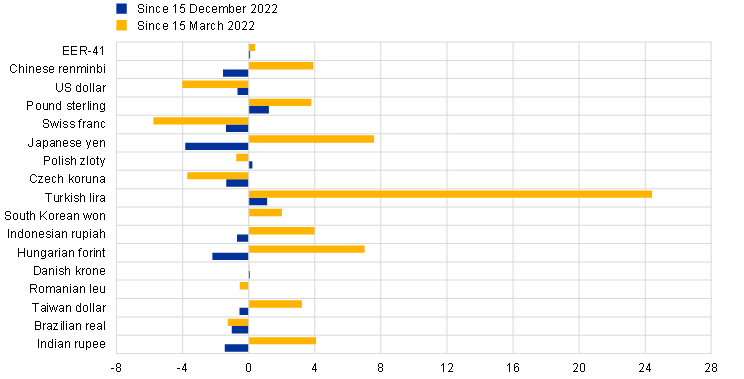
Source: ECB.
Notes: EER-41 is the nominal effective exchange rate of the euro against the currencies of 41 of the euro area’s most important trading partners. A positive (negative) change corresponds to an appreciation (depreciation) of the euro. All changes have been calculated using the foreign exchange rates prevailing on 15 March 2023.
5 Financing conditions and credit developments
In January 2023 bank lending rates rose further, reflecting increases in the key ECB interest rates. Bank lending to firms and households also moderated further in January amid higher interest rates, weaker demand and tighter credit standards. Over the period from 15 December 2022 to 15 March 2023 the cost of equity financing declined substantially, while the cost of market-based debt financing recorded only a slight increase. Growth in the total volume of external financing for firms slowed markedly. Monetary dynamics moderated sharply, driven by their most liquid components and slower credit growth.
The funding costs of euro area banks increased in January, reflecting movements in market rates and higher deposit rates. The composite cost of debt financing of euro area banks increased further and stood at its highest level since 2014 (Chart 22, panel a). In January bank bond yields rose again, resuming the strong upward trend that started last year. Bank bond yields increased by almost 400 basis points between January 2022 and March 2023 (Chart 22, panel b). Deposit rates increased somewhat to 0.56% in January, from 0.50% in December, bringing the cumulated increase since the beginning of 2022 to around 50 basis points. This increase was significantly smaller than the 300 basis point rise in the key ECB interest rates during the same period. The sluggish adjustment of deposit rates to changes in policy rates and the resulting widening of the spread between deposit and policy rates is in line with patterns observed during past interest rate hiking cycles. This development mainly reflects the tendency of the remuneration of overnight deposits, which make up a large share of banks’ deposit base, to be less responsive to policy rate increases than the remuneration of time deposits, which closely mirrored changes in policy rates. One reason for this is that overnight deposits offer liquidity and payment services that are often not explicitly priced. The recalibration of the terms and conditions of the third series of targeted longer-term refinancing operations (TLTRO III), which took effect on 23 November 2022, also contributed to a normalisation of overall bank funding costs.[6] Between November 2022 and February 2023 banks made sizeable (mandatory and, in particular, voluntary) repayments of funds borrowed under TLTRO III (€896 billion), reducing outstanding amounts by around 42% following the recalibration. Furthermore, since the end of 2021 banks have increased their issuance of bonds amid the winding-down of TLTROs and the slowdown in deposits. In terms of balance sheet strength, euro area banks are well capitalised overall, exceeding regulatory requirements and capital targets, but the risks stemming from a weakening economic environment may worsen banks’ asset quality, and there are early signs of increasing credit risk, as, for example, suggested by developments in underperforming loans.
Chart 22
Composite bank funding rates in selected euro area countries
(annual percentages)
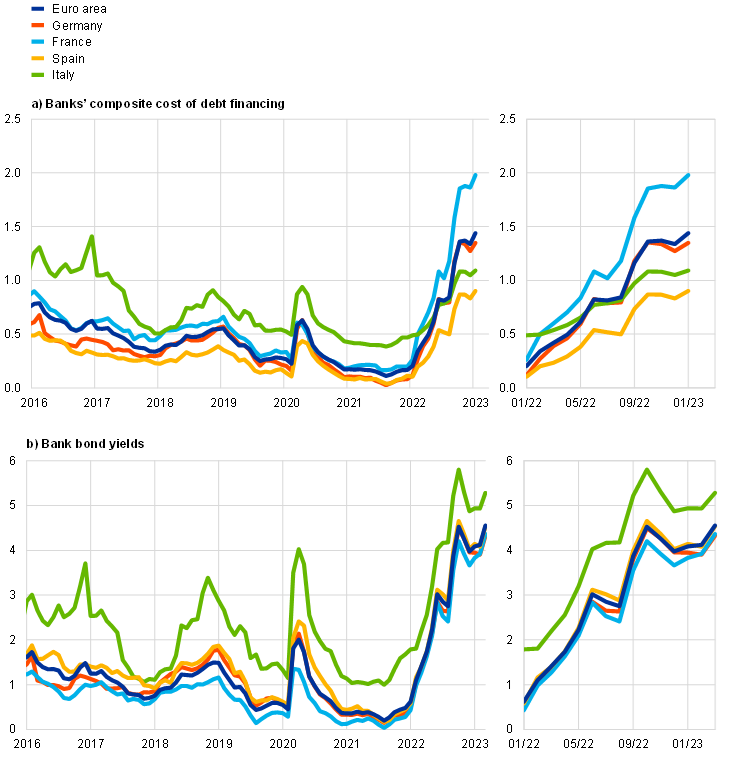
Sources: ECB, IHS Markit iBoxx indices and ECB calculations.
Notes: Composite bank funding rates are a weighted average of the composite cost of deposits and unsecured market-based debt financing. The composite cost of deposits is calculated as an average of new business rates on overnight deposits, deposits with an agreed maturity and deposits redeemable at notice, weighted by their respective outstanding amounts. Bank bond yields are monthly averages for senior-tranche bonds. The latest observations are for January 2023 for composite bank funding rates and 15 March 2023 for bank bond yields.
Bank lending rates for firms and households rose further in January 2023, reflecting the increases in the key ECB interest rates. Changes in the ECB’s monetary policy measures are being transmitted through to bank lending conditions. Since the beginning of 2022 increases in bank funding costs have pushed lending rates up sharply in all euro area countries (Chart 23), while credit standards have become tighter. Bank lending rates for loans to non-financial corporations (NFCs) increased to 3.63% in January 2023, compared with 3.41% in December 2022 and 1.43% a year before. Bank lending rates for loans to households for house purchase also rose further, to stand at 3.10% in January, compared with 2.94% in December and 1.33% a year before. These increases were faster than in previous hiking cycles, mainly reflecting the faster pace of policy rate hikes. Results from the January 2023 Consumer Expectations Survey suggest that consumers expect mortgage rates to increase further over the next 12 months. They also expect it to become harder to obtain housing loans. The spread between bank lending rates on small and large loans increased somewhat in January, reflecting developments in the rates on small loans, but remained close to its historical low. The cross-country dispersion of lending rates to firms and households remained stable, suggesting that the transmission of the ECB’s monetary policy tightening is working smoothly (Chart 23, panels a and b).
Chart 23
Composite bank lending rates for NFCs and households in selected countries
(annual percentages; standard deviation)
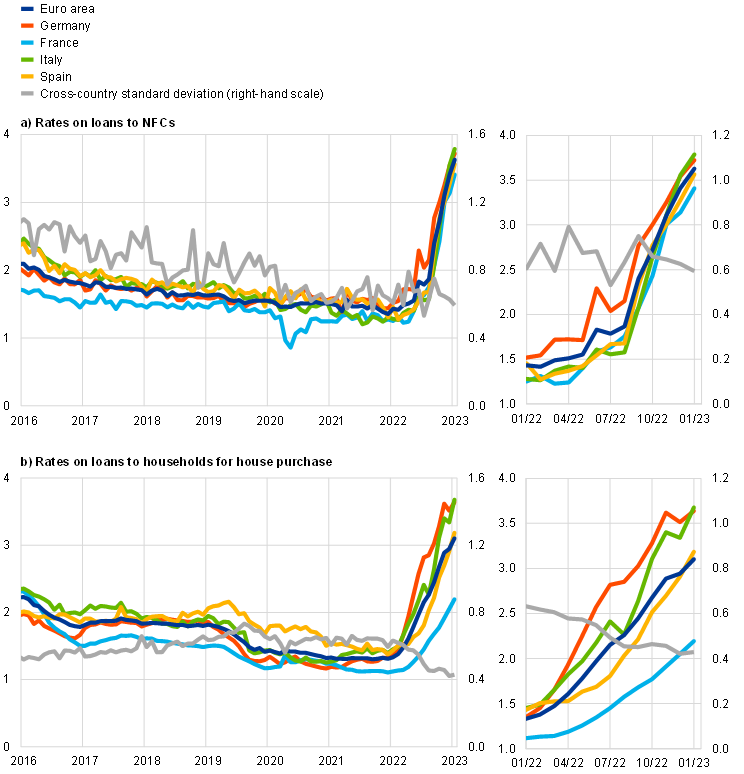
Source: ECB.
Notes: Composite bank lending rates are calculated by aggregating short and long-term rates using a 24-month moving average of new business volumes. The cross-country standard deviation is calculated using a fixed sample of 12 euro area countries. The latest observations are for January 2023.
Over the period from 15 December 2022 to 15 March 2023 the cost of equity financing for NFCs declined substantially, while the cost of market-based debt increased only slightly. Owing to lags in the available data on the cost of borrowing from banks, the overall cost of financing for NFCs, comprising the cost of bank borrowing, the cost of market-based debt and the cost of equity, can be calculated only up to January 2023, when it stood at 5.7%, around 15 basis points below its level in the previous month (Chart 24). This was the result of a decline in the cost of both market-based debt – owing both to lower risk-free rates and to the compression of corporate bond spreads – and equity financing that outweighed the increase in the cost of both short and long-term bank debt. While decreasing slightly from its peak in October 2022, in January 2023 the overall cost of financing remained close to the elevated levels last seen at the end of 2011. Over the review period the cost of market-based debt increased slightly, owing to the increase in the risk-free rates, which was most pronounced at the very short end of the curve. Corporate bond spreads in the high-yield segments also increased, while the spread on investment grade bonds remained virtually unchanged. The small increase in the risk-free rates, however, did not compensate for the sharp decline in the equity risk premium, thus leading to a sizeable decline in the cost of equity.
Chart 24
Nominal cost of external financing for euro area NFCs, broken down by components
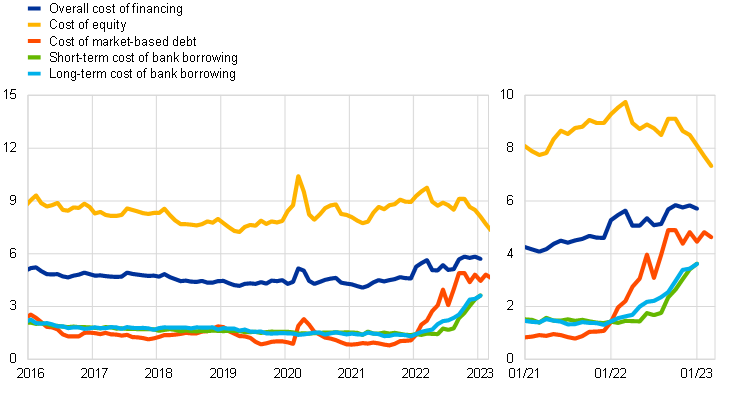
Sources: ECB and ECB estimates, Eurostat, Dealogic, Merrill Lynch, Bloomberg and Thomson Reuters.
Notes: The overall cost of financing for NFCs is calculated as a weighted average of the cost of borrowing from banks, market-based debt and equity, based on their respective outstanding amounts. The latest observations are for 15 March 2023 for the cost of market-based debt (monthly average of daily data), 10 March 2023 for the cost of equity (weekly data) and 31 January 2023 for the overall cost of financing and the cost of borrowing from banks (monthly data).
Bank lending to firms and households slowed further in January, amid higher interest rates, weaker demand and tighter credit standards. The annual growth rate of loans to NFCs declined to 6.1% in January from 6.3% in December (Chart 25, panel a). This slowdown was widespread across the largest economies and reflects higher interest rates, weakening demand and tighter credit standards. In terms of maturities, the contraction was especially visible for short-term loans linked to higher costs of working capital. The annual growth rate of loans to households also moderated, to 3.6% in January from 3.8% in December (Chart 25, panel b). While this development is mainly explained by the ongoing decline in the growth of housing loans, consumer credit and other lending also contributed somewhat to weaker lending to households. The main drivers of the slowdown in household borrowing were rising interest rates, tightening bank credit standards and weakening loan demand on the back of deteriorating housing market prospects and low consumer confidence.
Chart 25
MFI loans in selected euro area countries
(annual percentage changes; standard deviation)
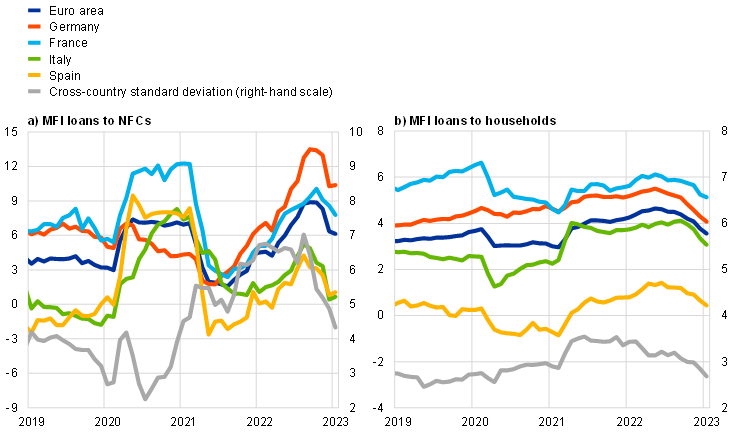
Source: ECB.
Notes: Loans from monetary financial institutions (MFIs) are adjusted for loan sales and securitisation; in the case of NFCs, loans are also adjusted for notional cash pooling. The cross-country standard deviation is calculated using a fixed sample of 12 euro area countries. The latest observations are for January 2023.
Growth in the total volume of external financing for firms slowed markedly, mainly reflecting weaker bank borrowing. The annual growth rate of external financing decreased from 3.2% in October to 2.3% in January 2023, reflecting lower financing needs of firms as economic activity slowed down and the tightening of banks’ credit standards (Chart 26). Net issuance of debt securities turned negative again in January after two months of partial recovery. The issuance of listed shares was muted overall but picked up again in December, driven by the public recapitalisation of one large energy-intensive firm.
Chart 26
Net external financing flows for euro area NFCs
(monthly flows; EUR billions)

Sources: ECB, Eurostat, Dealogic and ECB calculations.
Notes: Net external financing is the sum of borrowing from banks (MFI loans), net issuance of debt securities and net issuance of listed shares. MFI loans are adjusted for loan sales, securitisation and cash-pooling activities. The latest observations are for January 2023.
The reallocation of funds from overnight deposits to time deposits continued in January, reflecting changes in the relative remunerations of these instruments. The annual growth rate of overnight deposits turned negative in January and stood at -1.3%. The sharp decline in the growth of overnight deposits since the second quarter of 2022 (Chart 27) is explained by the large-scale substitution of overnight deposits with time deposits and lower economic growth. This portfolio reallocation has been triggered by the higher remuneration of time deposits relative to overnight deposits. This is in line with historical patterns during tightening cycles, according to which the remuneration of overnight deposits adjusts sluggishly to policy rate changes, while the remuneration of time deposits adjusts faster, implying a widening of interest rate spreads. However, the shift towards time deposits in the current tightening cycle is stronger than in past tightening cycles, as the share of overnight deposits had become larger than usual during the period of low interest rates when the opportunity cost of holding very liquid assets was particularly low.
Chart 27
M3, M1 and overnight deposits
(annual growth rate, adjusted for seasonal and calendar effects)
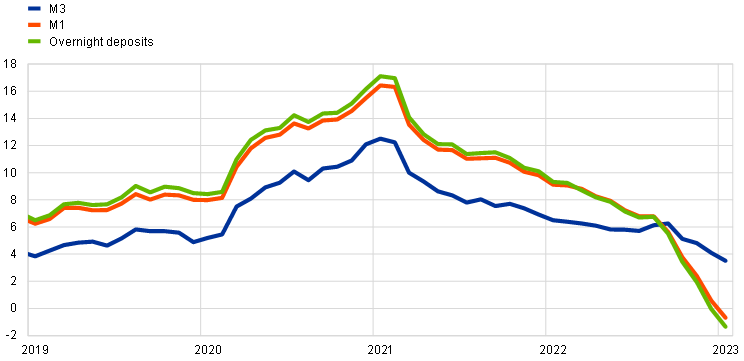
Source: ECB.
Note: The latest observations are for January 2023.
Monetary dynamics moderated sharply in the fourth quarter of 2022 and January 2023, driven by its most liquid components and slower credit growth. Annual broad money (M3) growth decreased to 3.5% in January from 4.1% in December (Chart 27). The declining trend continued to be driven by the phasing out of Eurosystem net asset purchases and TLTROs, weaker credit dynamics amid higher interest rates and a gradual shift by banks towards longer-term funding sources. Monetary outflows from the euro area to the rest of the world dampened broad money growth in January in the context of net sales of euro area government securities by non-residents. As regards the components of broad money, the growth of the narrow aggregate M1 recorded a further marked decline and turned negative for the first time since the start of Economic and Monetary Union, thus making a negative contribution to M3 growth. This development is also being driven by the shifting of funds from overnight deposits to better-remunerated time deposits in the context of higher rates.
6 Fiscal developments
According to the March 2023 ECB staff macroeconomic projections, the euro area fiscal outlook continues to improve, but the deficit and debt ratios remain well above pre-pandemic levels. The euro area deficit ratio is projected to fall to 3.4% in 2023 and to 2.4% in 2024, remaining at this level in 2025. The euro area fiscal stance is projected to be broadly neutral in 2023 and to tighten significantly in 2024, before turning neutral again in 2025. The debt-to-GDP ratio of the euro area is projected to decline from an estimated 91% in 2022 to about 87% in 2025. The baseline fiscal projections continue to be surrounded by high uncertainty, especially regarding the scale of energy support in view of the recent decline in energy prices. From a policy perspective, government support measures to shield the economy from the impact of high energy prices should be temporary, targeted and tailored to preserving incentives for lower energy consumption. As energy prices fall and risks around the energy supply recede, it is important to start rolling back these measures promptly and in a concerted manner. Fiscal measures falling short of these principles are likely to drive up medium-term inflationary pressures, which would call for a stronger monetary policy response. In the same vein, the Eurogroup Statement published on 13 March 2023 calls for Member States, in the absence of renewed price shocks, to continue phasing out energy support measures, which would also contribute to reducing government deficits. Moreover, in line with the EU’s economic governance framework, fiscal policies should be oriented towards making our economy more productive and gradually bringing down high levels of public debt. The reform of the EU’s economic governance framework should be concluded rapidly.
According to the March 2023 ECB staff macroeconomic projections, the euro area general government budget balance will improve over the projection horizon.[7] [8] The euro area budget deficit is projected to decline to 3.4% of GDP in 2023 and to fall more significantly in 2024, to 2.4% of GDP, remaining unchanged in 2025 (Chart 28). A statistical reclassification from cash to accrual terms of tax credits for housing construction improvements in Italy led to significant revisions of the expected euro area fiscal deficit. The deficit was revised up by about 0.3 percentage points of GDP in 2022 (to 3.7% of GDP), and down by around 0.1 percentage points over the rest of the projection horizon. Apart from Italy’s statistical reclassification, in the absence of major budget news, the euro area deficit outlook is mainly influenced by the downward rescaling of the fiscal support measures being implemented by governments in response to the energy crisis and high inflation. These measures are now estimated to amount to 1.8% of GDP at the euro area level in 2023 from more than 1.9% of GDP in the December projections, and to 0.5% of GDP in 2024 (Box 9).
Chart 28
Budget balance and its components
(percentages of GDP)
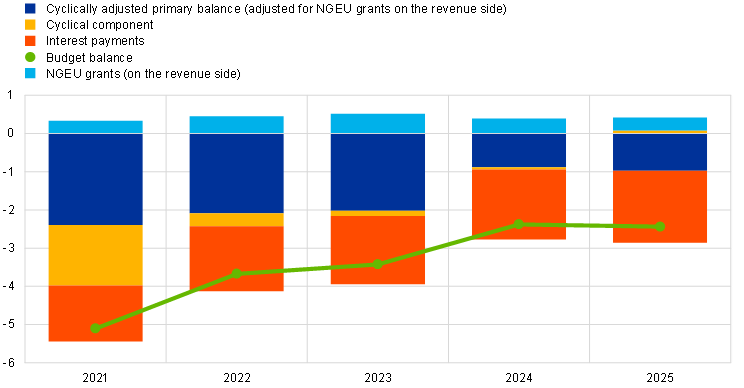
Sources: ECB calculations and March 2023 ECB staff macroeconomic projections.
Notes: Data refer to the aggregate general government sector of euro area countries. The general government budget balance and its components are adjusted for the estimated impact of a statistical reclassification in Italy over the fiscal projection period 2022-2025. For past data (2021), this adjustment will be available in the context of Eurostat’s April 2023 Excessive Deficit Procedure notifications and the June 2023 Eurosystem staff macroeconomic projections (both forthcoming).
The euro area fiscal stance is estimated to be broadly neutral in 2023 and to tighten significantly in 2024, before turning neutral again in 2025.[9] The broadly neutral fiscal stance in 2023 is explained by a partial projected reversal of the revenue windfalls from 2021 to 2022, broadly offset by some tightening in the overall discretionary measures, reflecting the withdrawal of part of the stimulus measures that governments implemented in response to the pandemic crisis and the statistical reclassification in Italy. In 2024 the fiscal stance is projected to tighten more significantly, mainly on account of the withdrawal of about 70% of the energy and inflation-related fiscal support implemented by euro area governments in 2023. The support stemming from funds granted under the Next Generation EU (NGEU) programme is also projected to be scaled downwards compared with 2023, while some further reversal of revenue windfalls is expected to mitigate the tightening of the fiscal stance in 2024-25.
The ratio of euro area government debt to GDP is projected to continue to decline to slightly less than 87% of GDP by 2025. After the debt ratio increased by approximately 13 percentage points to around 97% in 2020 owing to euro area governments’ responses to the COVID-19 crisis, it is expected to reach 91% of GDP in 2022, decline to around 89% of GDP in 2023, and decrease further to about 87% of GDP in 2025. This reduction is mainly on account of negative differentials between interest rates and nominal GDP growth, which, while narrowing after 2022, are projected to continue to more than compensate for the primary deficits (Chart 29). Deficit-debt adjustments should be broadly neutral in cumulative terms over the whole projection horizon. Notwithstanding this gradual decline, by 2025 the euro area aggregate debt ratio is expected to remain above its pre-pandemic level (by almost 3 percentage points).
Chart 29
Drivers of change in euro area government debt
(percentages of GDP, unless otherwise indicated)
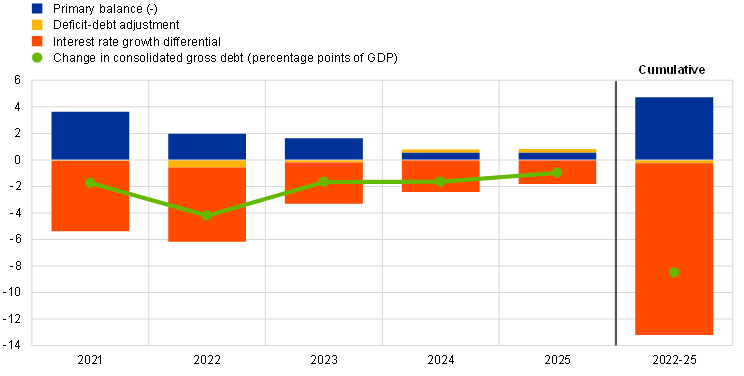
Sources: ECB calculations and March 2023 ECB staff macroeconomic projections.
Note: The data refer to the aggregate general government sector of euro area countries.
Compared with the December 2022 Eurosystem staff macroeconomic projections, the euro area budget balance path has been sightly revised upwards over the period 2023-25. The upward revision is only marginal, despite an expected increase in interest payments from 2024 to 2025. The debt ratio has been revised downwards, mainly reflecting the improvement in the primary balance.
Government support measures to shield the economy from the impact of high energy prices should be temporary, targeted and tailored to preserving incentives for lower energy consumption. As energy prices fall and risks around the energy supply recede, it is important to start rolling back these measures promptly and in a concerted manner. Fiscal measures falling short of these principles are likely to exacerbate inflationary pressures, which would necessitate a stronger monetary policy response. Moreover, in line with the EU’s economic governance framework, fiscal policies should be oriented towards making our economy more productive and gradually bringing down high levels of public debt. Following the release of the Communication by the European Commission on 9 November 2022 and of the Council Conclusions on “Orientations for a reform of the EU economic governance framework” for the ECOFIN Council meeting on 14 March 2023, the reform of EU economic governance should be concluded rapidly.
Boxes
1 What shapes spillovers from US monetary policy shocks to emerging market economies?
Emerging market economies (EMEs) are facing a challenging and uncertain macroeconomic environment, with weakening global demand, high inflation amid supply shocks and a synchronised tightening of monetary policy all acting as headwinds to growth. This box studies one of those headwinds – the impact of the Federal Reserve System’s tightening of monetary policy in the United States – and analyses factors and channels shaping spillovers to large and systemically important EMEs. Overall, EMEs have tended to exhibit greater resilience to shifts in global financing conditions during the current tightening cycle relative to the past, potentially on account of a reduction of their macro-financial vulnerabilities in recent decades. However, there is some heterogeneity in the performance of countries in this regard. We find that the impact of US monetary policy shocks varies across EMEs and is shaped by macro-financial vulnerabilities and monetary policy actions at the national level.
More2 Oil price developments and Russian oil flows since the EU embargo and G7 price cap
New sanctions on Russia’s oil exports have come into effect in recent months, including EU bans on seaborne oil imports from Russia and price caps on Russian oil in response to Russia’s continuing war of aggression in Ukraine. The EU ban on seaborne imports of Russian crude oil entered into force on 5 December 2022, followed by the embargo on refined oil products as of 5 February 2023. In tandem with the EU embargoes, the G7, the EU and partner countries have also prohibited the provision of maritime services[10] for Russian crude oil shipments and for Russian oil products, unless the oil is being purchased at or below a capped price.[11] The oil price cap for Russian crude oil was set at USD 60 per barrel, which is currently above the market selling price for the majority of Russian crude oil exports. Two price cap levels were imposed on refined products: one at USD 100 per barrel for petroleum products traded at a premium to crude oil, such as diesel, kerosene and gasoline; and one at USD 45 per barrel for petroleum products traded at a discount to crude oil, such as fuel oil and naphtha. The price cap mechanism is intended to restrain Russian oil revenues by capping the price, while still allowing the supply of Russian oil to the global market, thereby avoiding spikes in international oil prices. This box provides an initial assessment of the impact of the new sanctions on international oil prices and Russian seaborne oil exports.
More3 Friend-shoring global value chains: a model-based assessment
In recent years, geopolitical considerations have started to play an increasing role in global trade relations. While criticism of globalisation pre-dated the coronavirus (COVID-19) pandemic, geopolitical tensions have strengthened, particularly in the face of the pandemic and Russia’s invasion of Ukraine. The global trade disruptions experienced since 2020 have raised concerns over the resilience of supply chains and reinforced discussions about economic security. As a result, some countries have started taking supply chain measures aimed either at “reshoring” (bringing production home) or “friend-shoring” (sourcing inputs from suppliers in allied countries) in order to secure access to critical production inputs (for example China’s “dual circulation” strategy, the US Chips Act, and the European Union’s (EU’s) “open strategic autonomy”).[12]
More4 Global value chains and the pandemic: the impact of supply bottlenecks
This box analyses how the pandemic affected global value chains. It uses data for France, in particular between September 2020 and December 2021 when supply bottlenecks emerged.[13] The pandemic resulted in a contraction of demand and supply that occurred both domestically and internationally. For this reason, firms engaged in international trade were exposed to international disruptions on top of domestic ones: a reduction in supply resulted in shortages of intermediate inputs for importing firms, which coincided with weaker foreign demand for exporting firms. Firms involved in global value chains (“GVC” firms), namely firms that both import and export, faced both of these challenges simultaneously. Anecdotal evidence shows that the constrained availability of key inputs acted as a drag on the production capacity of firms involved in global value chains and therefore on their exports, for instance in the case of the availability of microchips in the automotive industry.[14] This box, based on highly granular trade data for the full universe of French firms, shows that participation in global value chains increased firms’ vulnerability to the economic implications of the pandemic. The results can be informative for developments in the euro area in general, as the dynamics of French exports during the pandemic, as well as their exposure over time to supply bottlenecks, were similar to those observed for the euro area as a whole in terms of the timing and size of the adjustment.[15]
More5 Who foots the bill? The uneven impact of the recent energy price shock
The recent surge in euro area energy prices led to a significant deterioration in the energy terms of trade. This deterioration (defined as the ratio of export to import prices) induced a cumulative loss of 2.4 percentage points of GDP between the third quarter of 2021 and the third quarter of 2022, the largest five-quarter loss on record since the launch of the euro (Chart A, red dot).[16] So how did this loss spread across households and firms? To assess the uneven impact of the recent rise in the price of imported energy in the euro area, this box takes a two-step approach. First, it uses disaggregated data to disentangle the effects of the recent energy terms-of-trade deterioration on final expenditures and aggregate income, allocating the implied purchasing power losses across the household income distribution. Second, the box uses structural models to identify the energy price shock underlying the recent terms-of-trade deterioration and to gauge its direct, indirect and second-round effects on the overall economy.[17] Throughout the box, variables are expressed in nominal terms.
More6 Results of the 2022 climate risk stress test of the Eurosystem balance sheet
In 2022 the ECB conducted a climate risk stress test of the Eurosystem balance sheet as part of its action plan to include climate change considerations in its monetary policy strategy.[18] The aims of this exercise were to (i) analyse the sensitivity of the Eurosystem’s financial risk profile to climate change; and (ii) enhance the Eurosystem’s climate risk assessment capabilities. The scope of the exercise covered a number of the Eurosystem’s monetary policy portfolios, namely its holdings of corporate bonds, covered bonds, asset-backed securities (ABSs), as well as its collateralised credit operations.
More7 Backcasting real rates and inflation expectations – combining market-based measures with historical data for related variables
Markets for financial products linked to inflation in the euro area offer valuable insights into market participants’ expectations for inflation and real interest rates, but these financial instruments have only been available since the early 2000s. The yields on inflation-linked bonds (ILBs) and the interest rates on inflation-linked swaps (ILSs) incorporate market participants’ expectations for inflation and real interest rates over periods from one to 30 years. From a central bank’s perspective, the information extracted from these instruments can help to assess the effectiveness of its monetary policy decisions and guide the future course of monetary policy. In the euro area, however, the history of these data spans a very limited number of policy and business cycles, as markets for euro area inflation-linked products emerged only in the early 2000s. This limits the analysis of structural economic relationships.[19]
More8 Liquidity conditions and monetary policy operations from 2 November 2022 to 7 February 2023
This box describes liquidity conditions and the ECB’s monetary policy operations during the seventh and eighth reserve maintenance periods of 2022. Together, these two maintenance periods ran from 2 November 2022 to 7 February 2023 (the “review period”).
More9 Update on euro area fiscal policy responses to the energy crisis and high inflation[20]
This box provides updated estimates on the fiscal support provided by euro area governments in response to the energy crisis and high inflation, reflecting the March 2023 ECB staff macroeconomic projections.[21] It updates the budget balance cost of the discretionary energy and inflation compensatory measures to reflect the latest developments in energy prices and changes in fiscal policy since the December 2022 Eurosystem staff macroeconomic projections. It also provides more granular information on the design and timing of these fiscal policy support measures. This includes an assessment of the energy price caps and the quarterly profile of the measures, which help to give a more accurate indication of the transmission of such measures to inflation.[22]
MoreArticle
1 Fiscal policy and high inflation
The euro area, like other advanced economies, has been facing challenges posed by the rapid and strong increase in inflation. Since mid-2021, inflation in the euro area has increased at a pace last seen in the 1970s and early 1980s, after having been below the ECB’s 2% target for almost a decade. Headline year-on-year inflation, as measured by the Harmonised Index of Consumer Prices (HICP), rose from 1.9% in June 2021 to 10.6% in October 2022, before falling to 9.2% in December 2022. The steep increase in inflation has to a large extent been the result of supply-side external shocks and, to a lesser extent, demand-driven internal factors.[23]
MoreStatistics
Statistical annex© European Central Bank, 2023
Postal address 60640 Frankfurt am Main, Germany
Telephone +49 69 1344 0
Website www.ecb.europa.eu
All rights reserved. Reproduction for educational and non-commercial purposes is permitted provided that the source is acknowledged.
This Bulletin was produced under the responsibility of the Executive Board of the ECB. Translations are prepared and published by the national central banks.
The cut-off date for the statistics included in this issue was 15 March 2023.
For specific terminology please refer to the ECB glossary (available in English only).
ISSN 2363-3417 (html)
ISSN 2363-3417 (pdf)
QB-BP-23-009-EN-Q (html)
QB-BP-23-009-EN-N (pdf)
Given the focus of this section on developments in the global environment, all references to world and/or global aggregate economic indicators exclude the euro area.
Occasionally, the high statistical volatility of intangible investment in Ireland considerably affects euro area investment dynamics. For more details, see box 1 “Non-construction investment in the euro area and the United States” in the article entitled “The recovery in business investment – drivers, opportunities, challenges and risks”, Economic Bulletin, Issue 5, ECB, 2022.
See the box entitled “Global value chains and COVID-19 - the impact of supply bottlenecks” in this issue of the Economic Bulletin.
The March 2023 ECB staff macroeconomic projections for the euro area were finalised in early March and the cut-off date for the technical assumptions was 15 February 2023.
For a detailed review of measures of underlying inflation, see the ECB Blog entry “Inflation Diagnostics”.
See “ECB recalibrates targeted lending operations to help restore price stability over the medium term”, press release, ECB, 27 October 2022.
See “ECB staff macroeconomic projections for the euro area, March 2023”, published on the ECB’s website on 16 March 2023.
The historical data for Italy and the euro area cannot be revised until the full dataset for the Excessive Deficit Procedure notification is made available.
The fiscal stance reflects the direction and size of the stimulus from fiscal policies to the economy beyond the automatic reaction of public finances to the business cycle. It is measured here as the change in the cyclically adjusted primary balance ratio net of government support to the financial sector. Given that the higher budget revenues related to Next Generation EU grants from the EU budget do not have a contractionary impact on demand, in this context the cyclically adjusted primary balance is adjusted to exclude those revenues. For more details on the euro area fiscal stance, see the article entitled “The euro area fiscal stance”, Economic Bulletin, Issue 4, ECB, 2016.
Including trading and commodities broking, financing, shipping, insurance (including protection and indemnity), flagging and customs broking.
The G7, the EU and Australia together form the Price Cap Coalition, while Albania, Bosnia and Herzegovina, Iceland, Liechtenstein, Montenegro, North Macedonia, Norway, Switzerland and Ukraine have all pledged to follow EU sanctions against Russia.
Under the “dual circulation” policy adopted in 2020, China aims (i) to vertically integrate production and achieve self-reliance supported by its huge domestic market and (ii) to globalise China’s home-grown companies. The EU’s “open strategic autonomy” refers to the capacity of the EU to act autonomously in strategically important policy areas; notably in the economy by ensuring the resilience of the EU industrial system and its supply of critical inputs. The US Chips Act of 2022 creates large subsidies and incentives for the research, development and production of technological components in the United States.
This box is partially based on Lebastard, L., Matani, M. and Serafini, R., “GVC exporter performance during the COVID-19 pandemic: the role of supply bottlenecks”, Working Paper Series, No 2766, ECB, January 2023.
See the box entitled “Motor vehicle sector: explaining the drop in output and the rise in prices”, Economic Bulletin, Issue 7, ECB, 2022.
France has a similar composition of firms in international trade to other euro area countries. In particular, two-way traders make up a relatively low share of the total number of companies engaged in trade, but they account for the vast majority of total trade in terms of value (see Eurostat, “Globalisation patterns in EU trade and investment”, 2017 edition). The sourcing countries are also similar (see Marin, D., Schymik, J. and Tscheke, J., “Europe’s export superstars – it’s the organisation!”, Working Papers, No 2015/05, Bruegel, July 2015).
For details on the calculation of the terms of trade, see the box entitled “Implications of the terms-of-trade deterioration for real income and the current account”, Economic Bulletin, Issue 3, ECB, 2022.
The direct effects are the result of an immediate link between the specific expenditure/income components and imported energy, while the indirect effects capture the transmission of the energy price shock via the production and distribution chain. Second-round effects occur when agents change their consumption or investment behaviour in response to the shock or pass on the energy price effects to wage and price setting, depending on broader economic, institutional or policy features. The taxonomy of the different effects on the overall economy mirrors the taxonomy of the different effects of energy price hikes on inflation. See, for example, the box entitled “Wage share dynamics and second-round effects on inflation after energy price surges in the 1970s and today”, Economic Bulletin, Issue 5, ECB, 2022.
For further details, see the press release “ECB presents action plan to include climate change considerations in its monetary policy strategy”, ECB, 8 July 2021. The climate risk stress test was conducted by the ECB’s Directorate Risk Management in cooperation with the Eurosystem’s Risk Management Committee.
The analysis in the box is based on euro area ILS rates. While the market for these instruments has existed since the early 2000s, the analysis builds on a sample starting in 2005 only, a time by which the market is considered to have been fully developed. See e.g. Neri, S., Bulligan, G., Cecchetti, S., Corsello, F., Papetti, A., Riggi, M., Rondinelli, C. and Tagliabracci, A., “On the anchoring of inflation expectations in the euro area”, Questioni di Economia e Finanza, No 712, Banca d’Italia, September 2022.
This box updates the estimates provided in the article entitled “Fiscal policy and high inflation”, which is included in this issue of the Economic Bulletin but was pre-released on 13 February 2023. It refers to government measures with an impact on the budget balance. In addition, some governments have enacted regulatory measures limiting the increase in energy prices that may not have a direct budget balance impact and/or other forms of liquidity support, such as guarantees. The latter would, in principle, affect their budget balances only if the guarantees (contingent liabilities) are activated.
The fiscal policy assumptions and projections in the context of the March 2023 ECB staff macroeconomic projections were finalised in early March 2023.
For an updated quantification of the impact of these measures on inflation over the period 2023-25, see the ECB staff macroeconomic projections published on 16 March 2023.
ECB, “June 2022 Eurosystem staff macroeconomic projections for the euro area”. These projections show that energy remained the main driver of HICP inflation, particularly after Russia’s invasion of Ukraine on 24 February 2022 and further supply chain disruptions, with all main subcomponents (fuels, electricity and gas) recording high price dynamics. For an empirical decomposition of HICP inflation excluding energy and food, see the box entitled “The role of demand and supply in underlying inflation – decomposing HICPX inflation into components”, Economic Bulletin, Issue 7, ECB, 2022.