


What does new micro price evidence tell us about inflation dynamics and monetary policy transmission?
Published as part of the ECB Economic Bulletin, Issue 3/2024.
1 Introduction
Inflation depends on whether individual firms decide to change the prices of their goods and services and, if so, by how much. Each month, some prices increase, some decrease and the rest (usually the majority) remain unchanged. These price-setting decisions depend on factors that are specific to the individual firm or to the industry in which it operates, as well as on aggregate shocks and general macroeconomic conditions that affect all firms.
Price adjustment in the data is “lumpy”, meaning that individual prices change infrequently, but price increases and decreases can be large, with both elements being crucial determinants of inflation dynamics. The frequency of price adjustment matters for the transmission of monetary policy, as it influences the speed at which changes in the monetary stance affect inflation. In addition, the size of price changes, i.e. by how much reset prices differ from the prices charged by firms before the adjustment, also has an impact on inflation dynamics.[1] A key factor is whether price setting is state dependent, that is, whether a firm’s decision to change prices seeks to balance a fixed cost incurred from resetting prices (known as the “menu cost”) against the loss from keeping prices unchanged but misaligned with their reset values.[2] When a firm’s loss from the price misalignment is large enough relative to the menu cost – owing to large shifts in demand or nominal costs, for example – the firm will change its price. As a result, firms are more likely to change those prices that are more misaligned. In this case, sizeable price changes can be associated with small aggregate shocks, possibly amplifying the reaction of aggregate inflation. Moreover, since the decision of changing prices depends on the state of the economy, non-linear effects on the frequency of price changes are also possible, depending on the size of aggregate shocks.
Whether inflation rises as a result of larger average price increases or because of more frequent price changes has consequences for inflation dynamics. If, for instance, firms change prices more frequently in response to a large shock to nominal costs, the pass-through to consumer prices will be faster and inflation will be initially higher, albeit more short-lived, than if the frequency of price changes had remained constant. Sharp increases in the frequency of price changes have been observed empirically in periods of elevated inflation and can be explained by economic models that feature state-dependent price setting. In these models, for a given menu cost, large demand or cost shocks cause prices to be more misaligned with their reset values, thus increasing the likelihood of price changes. Therefore, state-dependent price setting typically implies a non-linear relation between the frequency of price changes and inflation: at relatively stable inflation rates, the frequency of price changes is relatively constant over time, whereas large changes to the inflation rate (e.g. owing to large shocks) imply sharp changes to the frequency of price setting. Conversely, in the main alternative model of price setting (known as a “time-dependent” model), prices change exogenously and independently of their misalignment, so the frequency of price changes is not affected by inflation swings. Observing the characteristics of firm-level price changes is key to determining the degree of state dependence in pricing behaviour more accurately, even when inflation is relatively low.
How often and by how much prices change over time, as well as how this affects inflation, can be best studied with microdata, the collection and analysis of which have been at the heart of the work of the Price-setting Microdata Analysis Network (PRISMA). The Eurosystem’s Inflation Persistence Network (IPN) pioneered studies of micro price data in the early 2000s. Its successor, the PRISMA research network set up by the European System of Central Banks, revamped and extended the IPN’s analysis of firms’ price-setting behaviour. The microdata collected by PRISMA comprise 135 million individual price quotes used to build aggregate price indexes such as the Harmonised Index of Consumer Prices (HICP) in 11 euro area countries from 2010 to 2019. These price quotes encompass 166 product categories, amounting to around 60% of the HICP basket (but excluding categories such as energy and unprocessed food). PRISMA also reported and used new price-setting statistics (such as the full distribution of the size of price changes, which is crucial for understanding firms’ behaviour) and documented their evolution over time. Finally, it examined how the frequency and size of price changes shape the transmission of monetary policy and inflation dynamics, including in response to demand and supply shocks.
This article discusses the evidence on price setting gathered by PRISMA and focuses on the relation between inflation and the characteristics of the distribution of firm-level price changes.
2 Evidence on state-dependent price setting from microdata
State dependence in price setting, as defined above, implies that the prices that are more likely to change are those that are further away from their reset values; this implication provides an important test of the theory, based on microdata. The reaction of inflation to shocks depends not only on how many prices change, but also on which prices change and by how much. This can be as important as the frequency of price changes. If changes in the prices that are adjusted are large, reflecting significant misalignments, then the aggregate price level may be very flexible and respond strongly to aggregate shocks, even if only a few firms change their prices. Measuring this feature (called the “selection effect”) is particularly challenging because price gaps – defined as the difference between the current price and the counterfactual reset price a firm would like to choose – are unobservable.
PRISMA’s research overcomes the challenge of directly testing the extent of the selection effect, as a way to gauge the relevance of state-dependent pricing, by using supermarket scanner data. These data make it possible to develop a proxy measure of the price gap that, even in an environment of stable inflation, provides information about the extent of state dependence, at least in the pricing of goods sold in supermarkets. Calculating a proxy for each product’s price gap makes it possible to look at the shape of its hazard function (the “price-gap hazard”), defined as the probability that its price will change as a function of the price gap.[3] Price-gap hazard functions were estimated for four large euro area countries (Germany, France, Italy and the Netherlands) between 2013 and 2017 and for the United States between 2001 and 2012. While these periods do not overlap, they were both characterised by low and stable inflation.
The estimated price-gap hazard functions provide clear microeconomic evidence that firms’ pricing behaviour is state dependent. Chart 1 panel a) shows that the probability that a firm will adjust the price of a product rises with the price gap, both in the euro area (based on the four large countries considered) and in the United States. The fact that the likelihood of a price adjustment depends on the size of the price gap is consistent with state dependence in price setting. For instance, a negative 10% price gap is associated with a 15% probability of a price increase. By contrast, in time-dependent models of price setting, prices change exogenously, for instance randomly with constant probability at each point in time in the popular Calvo model.[4] Nevertheless, the V-shape hazard functions suggest that state dependence is moderate, since the probability does not increase sharply with the price gap.[5] Chart 1 panel b) validates the price gap measures, showing a close relationship between the gap and the actual size of eventual price changes. The question then arises of how quantitatively relevant this evidence is for inflation dynamics following large shocks in the euro area. We will look at this question in the next two sections.
Chart 1
Price-gap hazard and the size of non-zero price changes as a function of the price gap
(price misalignment, percentages)
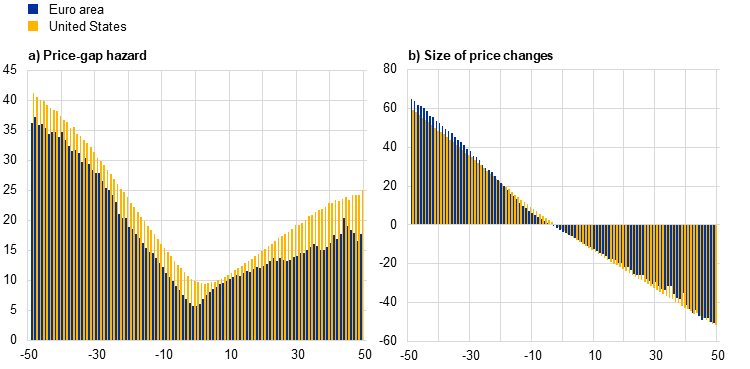
Source: Gautier et al.1)
Note: The chart shows the frequency of reference price changes (panel a) and the average size of non-zero reference price changes (panel b) as a function of the price gap for four euro area countries (Germany, France, Italy and the Netherlands) and the United States.
1) Gautier, E. et al., “Price adjustment in the euro area in the low-inflation period: evidence from consumer and producer micro price data”, Occasional Paper Series, No 319, ECB, Frankfurt am Main, 2023.
3 The theoretical and empirical relation between inflation and the frequency and size of price changes
A useful decomposition of monthly inflation is the number of prices that change (frequency of price adjustment) multiplied by the amount by which these change (average size of price changes). Specifically, denoting monthly inflation with and the frequency and average size of (non-zero) price changes with and respectively, we can write the following expression:[6]
Moreover, we can further decompose the frequency as the sum of the frequency of price increases () and price decreases (), i.e. . With this frequency decomposition, monthly inflation is obtained as the frequency of price increases multiplied by the size of average price increases minus the frequency of price decreases multiplied by the (absolute) size of average price decreases (. As shown by PRISMA research, in the euro area data the absolute size of average price decreases tends to be larger than that of price increases (with mean values, excluding sales prices, over the period from 2010 to 2019 standing at around 11.6% and 9% respectively). Therefore, the prevailing positive inflation rate in the data reflects the fact that price increases are more frequent than price decreases (on average, around 69% of price changes in the period from 2010 to 2019 were increases, excluding sales prices).[7]
In the 2010-19 low inflation period analysed by PRISMA, the limited cyclical variation in inflation was mostly driven by fluctuations in the average of price changes. As shown in Chart 2, small cyclical variations in frequency did not contribute greatly to fluctuations in aggregate HICP inflation[8] (excluding energy and unprocessed food, for which microdata were not available to PRISMA), which instead mainly reflected shifts in the average of non-zero price changes (Chart 3).
Over the same period, for a given frequency, variation in average price changes resulted mainly from variation in the share of price increases and decreases rather than from variation in their absolute size. Consistent with idiosyncratic shocks being the main driver of firm-level price changes during the low inflation period, average price changes responded to aggregate disturbances through variation in the relative share of price increases or decreases, rather than through variation in their absolute size. However, this “linear” behaviour of aggregate inflation breaks down when aggregate shocks become larger than usual, owing to the non-linearities in firm-level decisions discussed above.
Chart 2
Inflation and frequency of price changes over time
(left-hand scale: percentages, right-hand scale: year-on-year percentage change)
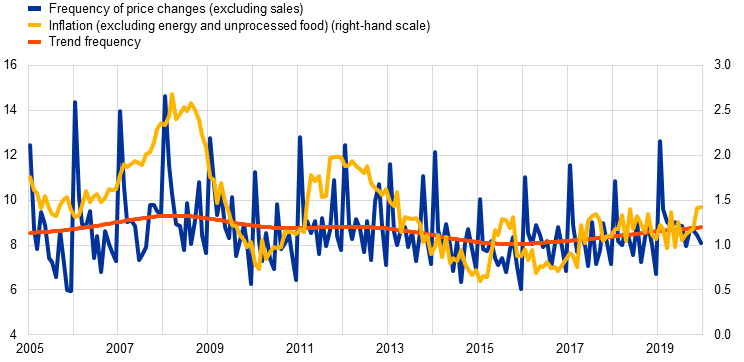
Source: Banque de France staff calculations.
Notes: Based on PRISMA HICP microdata. The trend is computed using the standard Hodrick-Prescott filter for monthly data.
Chart 3
Inflation and average size of (reset) price changes
(left-hand scale: percentages, right-hand scale year-on-year percentage change)
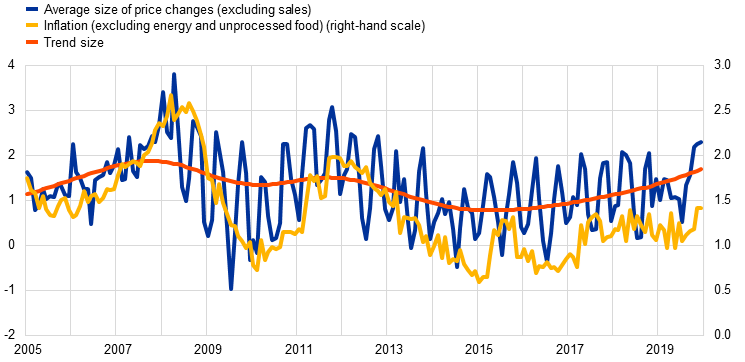
Source: Banque de France staff calculations.
Notes: Based on PRISMA HICP microdata. The trend is computed using the standard Hodrick-Prescott filter for monthly data.
Historical episodes of elevated inflation point to a positive relation between the level of inflation and both the frequency and the average size of non-zero price changes, reflecting a rise in the frequency of price increases. Some papers have documented the features of price adjustment in the mid-1970s and 1980s, when inflation was high and more volatile in advanced economies.[9] These papers have provided several insights into price adjustment patterns using consumer price index (CPI) micro price data for Norway and the United States, contrasting the mid-1970s and 1980s with periods when inflation was lower and less volatile. The frequency of price adjustment correlates much more strongly with inflation when the inflation rate is high and more volatile than when it is low and relatively stable. For instance, during the Great Inflation in the United States, in the period 1978-82 the frequency of price adjustment was over 15%, compared with 10% during the subsequent Great Moderation. The absolute size of price increases did not rise with inflation in the United States, while in Norway the absolute size of price changes actually fell with inflation. Results for periods of hyperinflation in other countries, such as Argentina and Mexico, corroborate these findings on the link between the level of inflation and the frequency of price changes.[10] Overall, when inflation is higher than 5%, the correlation between frequency and inflation becomes significant.
For the recent inflation surge, an update of PRISMA microdata for several euro area countries documents a sharp rise in the frequency of price changes, owing to a corresponding rise in the frequency of price increases. Box 1 presents results based on an update of PRISMA HICP microdata for seven countries. In line with the evidence discussed above, when inflation is low, there is little correlation between the frequency of price changes and inflation (Chart 4). Since inflation started to rise in the second half of 2021, the frequency of price changes has also risen, driven by an upsurge in the frequency of price increases. Regarding the absolute size of the price changes, there is no strong link before or after 2022. Further evidence on state dependence between April 2022 and January 2024 is provided by a new daily price dataset collected by the ECB via web scraping.[11] Box 2 details how the frequency of price increases of food items (retrieved from online supermarkets in Germany, Spain and Italy) rose significantly in 2022 but has declined in recent months towards its pre-2020 levels. These pieces of evidence, together with Box 3, suggest that retailers revise their prices more frequently when inflation is higher. Larger shocks lead to aggregate factors becoming an important motive for price changes, as predicted by state-dependent price-setting models. In turn, these models predict a faster pass-through of large cost shocks compared with small ones, resulting in higher and more short-lived inflation, as shown by the simulation results discussed in the next section.
Chart 4
Inflation and frequency of price adjustment
(x-axis: euro area HICP inflation excluding energy and food (year-on-year percentage change); y-axis: seasonally adjusted frequency of price adjustment (month on month))
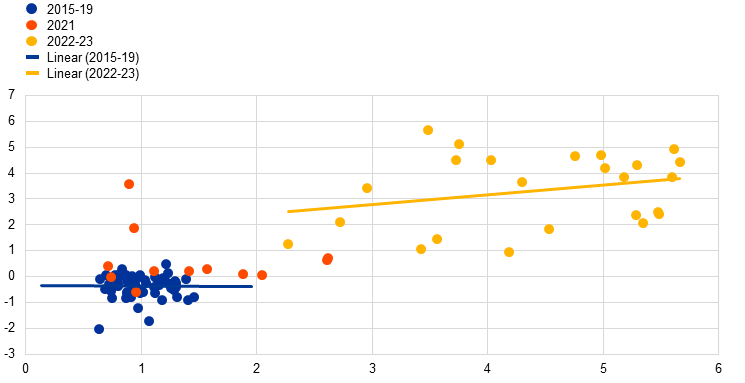
Source: Banque de France and ECB staff calculations.
Notes: Frequency of price adjustment based on consumer price micro-datasets from the national statistical institutes of Germany, Estonia, Spain, France, Italy, Latvia and Lithuania (see Box 1 for details). Each dot corresponds to the frequency of price adjustment in a month, minus the average frequency of price adjustment in that calendar month over the period 2011-19 on the y-axis and annual HICP inflation excluding energy and food in that month for the euro area on the x-axis. 2020 is excluded, as it was heavily affected by the coronavirus (COVID-19) pandemic. For more details on price setting during the pandemic, see Henkel, L. et al., “Price setting during the coronavirus (COVID-19) pandemic”, Occasional Paper Series, No 324, ECB, Frankfurt am Main, 2023.
Box 1
How price adjustment patterns change with higher inflation: recent evidence from euro area micro consumer price data
This box presents preliminary evidence on how the recent surge in inflation has affected patterns of consumer price adjustment in the euro area based on CPI microdata. For this purpose, we have updated the results of Gautier et al. to cover the most recent period (2021-23) for seven countries accounting for around 80% of euro area HICP (Germany, Estonia, Spain, France, Italy, Latvia and Lithuania).[12] The analysis is conducted on a common sample of 166 product categories covering food, non-energy industrial goods (NEIG) and services, which together account for around 60% of euro area HICP.[13]
Over the period 2021-22, the European economy was hit by a sharp rise in the cost of imported raw materials (mainly energy inputs), reflecting tensions in energy markets in the wake of the Russian invasion of Ukraine and the supply chain bottlenecks caused by the post-lockdown reopening of the economy. This surge in firms’ costs was transmitted to producer prices and then to consumer prices and inflation. The transmission was quicker than usual, with firms and retailers increasing the frequency at which they change their prices (Chart A).[14] In contrast with the low inflation period, where the frequency of price changes was very flat, at around 8.5% on average, the frequency of price changes increased over the course of 2022 to 12.5% on average. Prices appear to have been more flexible in response to the large inflation shock than they were in the low and less volatile inflation period between 2010 and 2019. The frequency of price changes declined somewhat over the course of 2023. This large shift in the frequency of price changes was mainly due to a sharp rise in the frequency of price increases, reflecting the fact that many retailers decided to increase their prices immediately instead of waiting to change them (as they used to do in the low inflation period) and suffering induced losses.
Chart A
Frequency of consumer price changes over time (all sectors)
(left-hand scale: percentages; right-hand scale: annual percentage change)
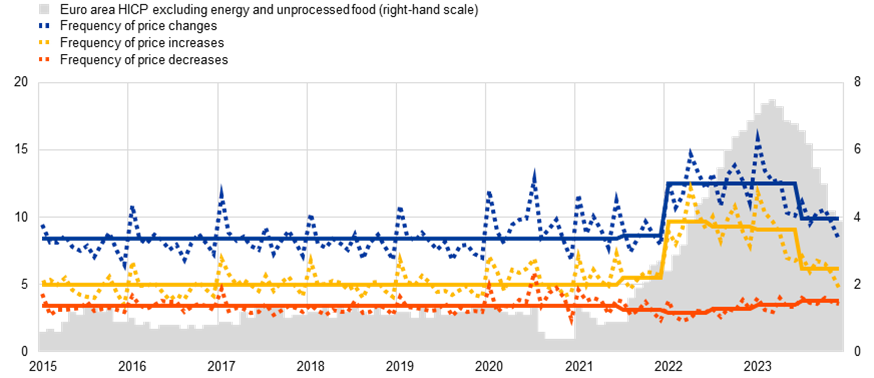
Source: Consumer price micro-datasets from the national statistics institutes of Germany, Estonia, Spain, France, Italy, Latvia and Lithuania.
Notes: The chart shows the weighted average frequencies of price changes (excluding sales). VAT changes in Germany (2020-21) and Spain (2020-23) have been excluded. The solid lines plot the average over the period 2015-21 and half-year averages over the period 2021-23. The latest observations are for December 2023.
The average size of (non-zero) price changes increased during the inflation surge (Chart B). This rise is related to the larger share of price increases among price changes over the recent period: 75% of price changes were price increases in the high inflation period, whereas this share was around 60% during the period between 2010 and 2019 in the countries considered. By contrast, even if aggregate shocks were large, the absolute sizes of price increases and price decreases remained stable at levels comparable to those seen during the low inflation period. This suggests that retailers decided to increase their prices more frequently, but by the same size as before, in order to limit the losses induced by not changing their prices. The increase in the frequency of price changes is consistent with the prediction of a state-dependent model of price setting with menu costs, but not with the predictions of a Calvo model, where the frequency remains stable. This broad pattern has been similar in all of the seven euro area countries for which updated CPI microdata are available for the period between 2021 and 2023.
Chart B
Size of consumer price changes over time (all sectors)
(left-hand scale: percentages; right-hand scale: annual percentage change)
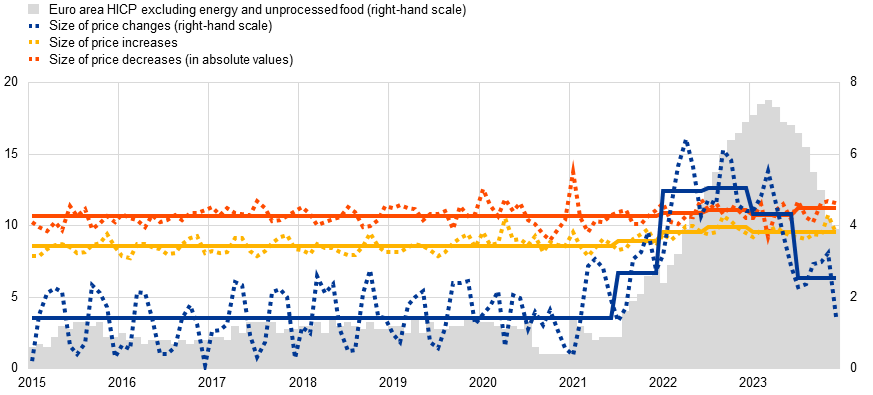
Source: Consumer price micro-datasets from the national statistical institutes of Germany, Estonia, Spain, France, Italy, Latvia and Lithuania.
Notes: The chart shows the weighted average sizes of price changes (excluding sales). VAT changes in Germany (2020-21) and Spain (2020-23) have been excluded. The solid lines plot the average over the period 2015-21and half-year averages over the period 2021-23. The latest observations are for December 2023.
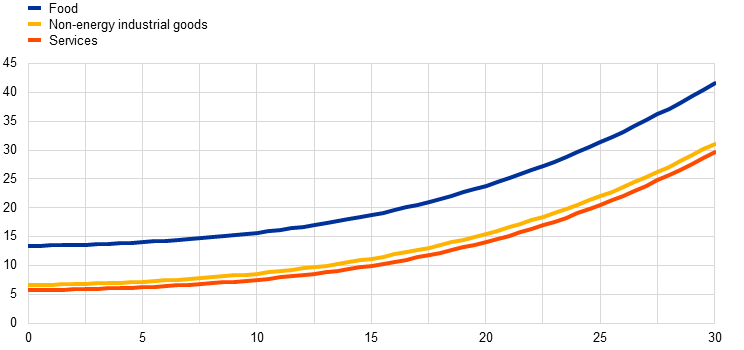
This sharp rise in the frequency of price increases was common to all broad product categories underlying the HICP (Chart C). Gautier et al. document that, on average, food prices are more flexible than NEIG or services prices.[15] The same finding holds for the more recent period: the rise in the frequency of price increases has been sharper for food products than for NEIG or services. In the food sector, the frequency of price increases rose from around 8% on average before 2020 to close to 15% in 2022, whereas price decreases were a little less frequent than usual. For NEIG and services, the rise in the frequency of price increases has also been significant, albeit much smaller than the one observed for food (with NEIG and services both recording a rise of around 3 percentage points), whereas the frequency of price decreases has remained mostly stable. Finally, the frequency of price increases fell in all three sectors during the second half of 2023.
Chart C
Frequency of consumer price changes over time, by aggregate product category
(percentages)
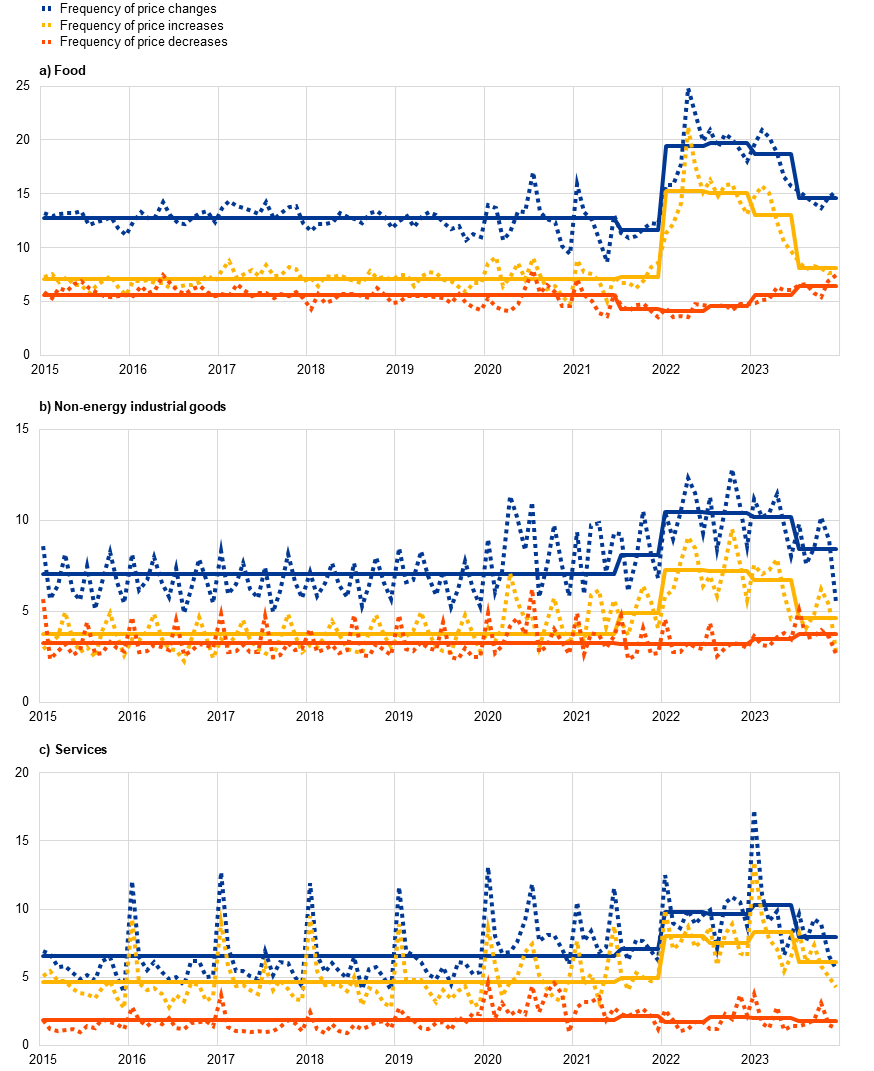
Source: Consumer price micro-datasets from the national statistical institutes of Germany, Estonia, Spain, France, Italy, Latvia and Lithuania.
Notes: The chart shows the weighted average frequencies of price changes (excluding sales). VAT changes in Germany (2020-21) and Spain (2020-23) have been excluded. The solid lines plot the average over the period 2015-21 and half-year averages over the period 2021-23. The latest observations are for December 2023.
Box 2
Insights into recent developments in price setting: evidence from micro-level daily price data from online supermarkets
This box presents preliminary evidence on state-dependent price setting using data from online supermarkets in three of the largest euro area countries (Germany, Spain and Italy) covering the most recent period (April 2022 to January 2024). The ECB’s Daily Price Dataset contains detailed information on each product, covering all product categories within the food basket in the respective countries. It can be used to understand how the recent surge in food prices has affected patterns of online price adjustment in the euro area.
Firms’ price-setting behaviour, as tracked by the Daily Price Dataset, clearly shows that the frequency of price increases in food items rose significantly in 2022 but has declined in recent months towards its pre-2020 levels. Chart A shows that the frequency of price increases of food items was elevated over the course of 2022 and reached a peak in February 2023. These levels are significantly higher than those observed before the pandemic. Based on CPI microdata, between 2010 and 2019, the monthly frequency of price changes was around 6.4% on average for processed food and 13.8% for unprocessed food. Online prices for processed food in Germany changed with a monthly frequency of around 4.1% on average between 2015 and 2019.[16] In 2023 the frequency of price increases fell, reflecting the fading impact of past shocks, and as of January 2024 it is returning towards pre-pandemic levels. In fact, the frequency of price increases is now similar to the frequency of price decreases. At the same time, the absolute size of price changes (increases or decreases) remained relatively unchanged. There is a significant level of heterogeneity across countries, as illustrated in Chart A panel b). The frequency of price increases has declined significantly in Germany and Italy, but less so in Spain, where it remains elevated.
Chart A
Frequency of food price changes over time
(percentages)
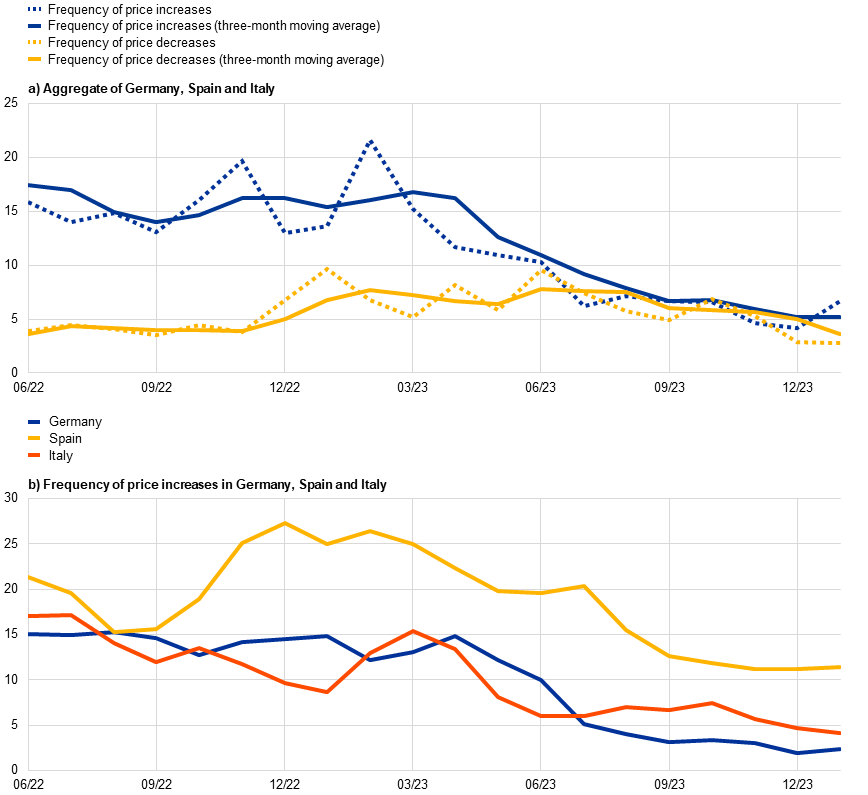
Source: ECB.
Notes: Panel a) shows the average monthly frequency of price increases and decreases of food products across Germany, Spain and Italy (dotted lines) and its three-month moving average (solid lines). Panel b) shows the three-month moving average frequency of price increases for Germany, Spain and Italy. The latest observations are for January 2024.
4 Implications of state-dependent pricing for the transmission of large inflationary shocks
PRISMA analysed the macroeconomic implications of the micro evidence on price setting by using simulations from economic models calibrated to match key characteristics of price setting in euro area microdata. The micro price evidence can be used to derive implications for the monetary policy transmission mechanism through the lens of state-of-the-art price-setting models which feature state dependence in firms’ price-changing decisions.
Large aggregate inflationary shocks are predicted to increase the frequency of price adjustment in state-dependent models of price setting calibrated to euro area price microdata. These price adjustment models are built on the notion that price changes do not occur randomly across firms but depend on how large the price gap of a product is. The larger a shock to nominal costs, the more firms will experience misaligned prices and decide to change them, driving up the aggregate frequency of price adjustment. Therefore, in a more volatile macroeconomic environment, the degree of price flexibility should increase, as discussed above. This feature is supported by the model analysis carried out by PRISMA.[17] Specifically, using economic models that allow for variation in the frequency of price adjustment depending on the state of the economy and which are calibrated using microdata from the pre-pandemic period collected by PRISMA results in sizeable increases in the frequency of price adjustment following large shocks affecting nominal costs. As documented by PRISMA, the frequency of price adjustment varies across the three main sectors analysed (processed food, non-energy industrial goods (NEIG) and services), with food prices changing much more often than NEIG and services prices. This reflects differences in cost volatility across sectors, which in turn stems from different cost structures – the services sector has a relatively larger share of less volatile labour costs, whereas the other two sectors have a relatively larger share of more volatile raw and intermediate inputs.
In the simulations, starting from a baseline with price adjustment only being driven by idiosyncratic shocks, the frequency of price changes is relatively flat for small aggregate shocks but increases at a non-linear pace as the cost shocks move beyond 10% (Chart 5), in line with the euro area evidence for the periods before and after the pandemic-related lockdowns.[18] Moreover, while the frequency increases in all three sectors, for a given size of shock, the largest increase is predicted to be in the processed food sector and the smallest in the services sector. This sectoral heterogeneity is consistent with the euro area evidence covering the recent surge in inflation, presented in Box 1.
Chart 5
Model-based relation between nominal cost shocks and the frequency of price changes
(x-axis: size of nominal cost shock (percentage); y-axis: monthly frequency of price changes (percentages))
Source: Dedola, L. et al., op. cit.
Note: Based on ECB staff calculations using PRISMA HICP microdata.
A higher frequency of price adjustment implies a frontloaded and faster pass-through of shocks to inflation. If the frequency of price adjustment increases, it means that more firms are revisiting their prices each period and incorporating the effects of the shocks. As prices become more flexible, this can lead to a faster reaction of inflation to the shock on impact. Additionally, all else being equal, the reaction becomes less persistent because more firms change their prices immediately after the shock rather than waiting until a later date. In the United Kingdom, this effect was found to be empirically relevant for inflation dynamics before the inflation surge.[19] Time-varying price flexibility associated with the change in the frequency of price adjustment in UK CPI microdata is a key factor shaping inflation dynamics in that country. Inflation was more volatile and less persistent in periods of high price flexibility, highlighting in general the importance of taking into account endogenous shifts in the frequency of price changes for understanding and forecasting inflation dynamics.
Similarly, large shocks to nominal costs have non-linear effects on inflation dynamics in the calibrated models. Non-linearities in price setting imply that, in the model-based simulations, the initial inflationary effects increase more than proportionally with the size of nominal shocks. However, these cost shocks must be larger than 15% for non-linearities to significantly accelerate simulated inflation dynamics in the aftermath. All else being equal, not only will inflation rise more quickly, but its convergence back to the central bank’s target rate will also be faster.
The impact of large shocks on the frequency of price changes should be temporary and disappear as inflation returns to its long-term trend. After firms have responded to a large cost shock by adjusting their prices more quickly, once the shock dissipates – and if there are no changes in other factors relevant for price adjustment – inflation should revert to its trend, and firms’ price-setting decisions should also become similar to those prevailing before the shock. As a result, the frequency of price changes should also converge back to pre-shock levels. In line with this theoretical prediction, Box 1, Box 2 and Box 3 present evidence from different sources that shows that the frequency of price changes fell significantly in 2023, together with the inflation rate, and is getting closer to its pre-pandemic levels.[20]
Workhorse macroeconomic models used in policy institutions do not typically allow for variation in the frequency of price adjustment, thereby potentially missing non-linearities when inflation is high and shocks are large. Workhorse models capture the price adjustment mechanism via a time-dependent pricing model in which the frequency of price adjustment is constant. Time-dependent pricing models are a good approximation when inflation is stable and aggregate shocks are small.[21] In these models, however, the frequency of price adjustment does not have any state-dependent feature. This means that they are certain to miss the non-linear effects stemming from the large shocks likely associated with the recent inflation surge. This feature of workhorse macroeconomic models does not necessarily make them less useful in informing policy decisions (such as in the context of economic projections), provided they are complemented with a judgement-based adjustment that takes into account such non-linearities (for example by trying to readjust the parameters governing price setting).
Box 3
Price setting during and after the high inflation period: evidence from a survey of large firms
This box summarises the findings of a short ad hoc ECB survey of leading euro area firms on their price-setting behaviour during and after the recent period of high inflation.[22] It is a partial update of a survey conducted in 2019.[23] 66 responses were received.
As discussed in Section 4, theory predicts that a firm will decide when to change its prices and by how much by balancing the cost of resetting prices with that of keeping prices unchanged but misaligned. This depends on the variation in firms’ costs and on the ability of firms to pass through cost changes as a function of market power, demand conditions and competitors’ prices. It may therefore be expected that, in the light of substantial cost increases, firms will have reviewed and changed their prices more frequently during the recent high inflation episode, but that price-setting behaviour should normalise again as inflation moderates. The survey sheds light on whether this is indeed the case and reveals the importance that firms attach to different factors when setting prices in practice.
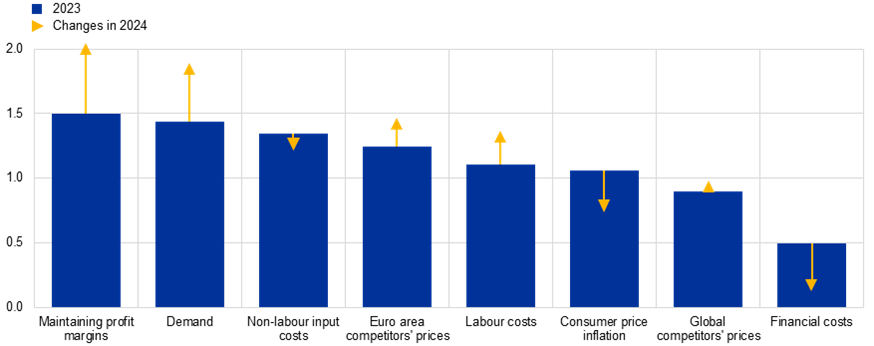
According to the responses, on average, firms considered maintaining profit margins; demand for their product or service; input costs, especially non-labour costs; euro area and global competitors’ prices and consumer price inflation to be important for their price-setting decisions in 2023 (Chart A). Financial costs were considered less important. To the extent that the response options overlapped, the answers on what was important for price setting differed very little from those in the 2019 survey.[24] For 2024, on average, respondents indicated that maintaining profit margins and demand for their product or service would be increasingly important, as would, albeit to a lesser extent, competitors’ prices and labour costs. Consumer price inflation and financial costs would become less important.
Chart A
Relevant factors for firms’ price-setting decisions
(average score of responses, 2023: 0 = not important, 1 = important, 2 = very important; changes in 2024:1 = more important, -1 = less important)
Source: ECB.
Note: Based on 63-65 responses depending on the item.
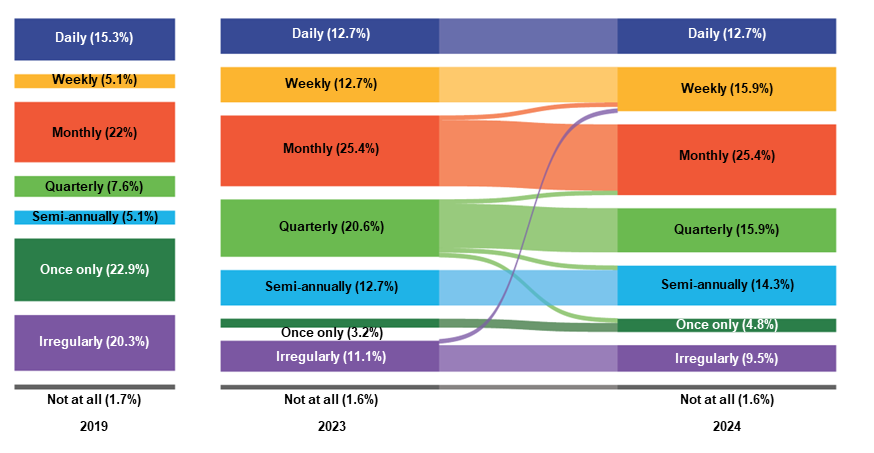
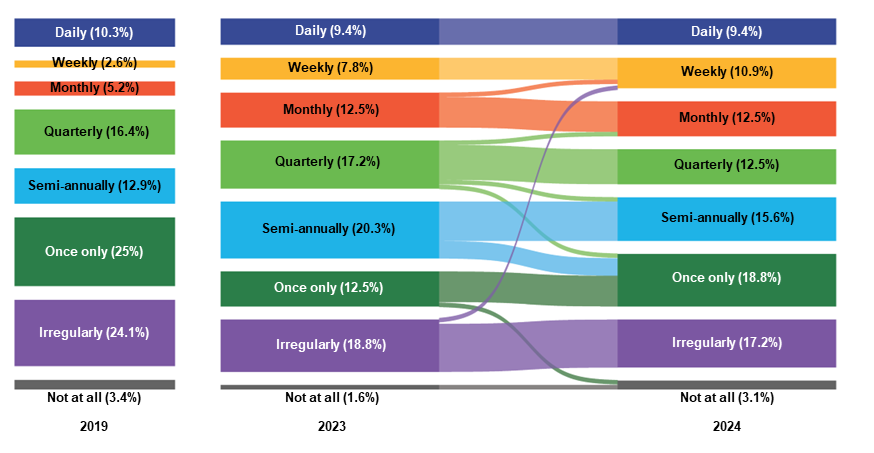
Firms’ replies suggest that the frequency of price reviews and changes was elevated in 2023 and that the frequency of price reviews will remain so in 2024, while the frequency of price changes will moderate somewhat (Chart B and Chart C). When compared with the 2019 survey, the main change in 2023 was the very sharp fall (to negligible levels) in the share of firms saying that they only reviewed prices annually and the sharp fall in the share of firms saying that they only changed prices annually. This was offset by increases in the shares of firms reviewing and changing prices at a semi-annual, quarterly or monthly frequency. Firms also tended to be moving from irregular to regular reviews. For 2024 only a small number signalled changes to their reviewing behaviour, and there was no clear direction of change in terms of higher or lower frequency. By contrast, a somewhat larger number of firms signalled a change in their expectations about how often they would change prices, and nearly all of these pointed to a lower frequency, mostly moving from semi-annual or quarterly price changes (back) to annual ones. Overall, the replies point to the average frequency of price changes in 2024 still being higher than in 2019.
Firms expect the growth of selling prices in 2024 to moderate more than the growth of input costs.[25] A subset of 24 firms opted to indicate the (expected) growth of their selling prices and input costs in 2023 and 2024. For 2023 they reported broadly similar selling price and overall input cost increases, at close to 6%. However, in 2024 selling price increases were expected to be consistently lower than input cost increases, suggesting that, in particular, labour cost increases in 2024 – which are expected to be roughly twice as high as non-labour cost increases – may be buffered to some extent by profit margins.
Chart B
Frequency of price reviews in 2019, 2023 and 2024
(percentage of responses)
Source: ECB.
Note: The figure shows the flows between frequencies from 2023 to 2024. The response options in the 2019 survey differed slightly, such that the options “Every 1-3 years” and “Less often than every 3 years” were mapped to the 2024 options of “Once only” and “Not at all”, as the question in the 2024 survey asked about changes in the previous/upcoming year.
Chart C
Frequency of price changes in 2019, 2023 and 2024
(percentage of responses)
Source: ECB.
Note: The figure shows the flows between frequencies from 2023 to 2024. The response options in the 2019 survey differed slightly, such that the options “Every 1-3 years” and “Less often than every 3 years” were mapped to the 2024 options of “Once only” and “Not at all”, as the question in the 2024 survey asked about changes in the previous/upcoming year.
5 Conclusion
The PRISMA research network gathered key empirical facts on nominal rigidities in the euro area based on microdata, providing evidence of state dependence in price setting even during the period of low and stable inflation. In a high inflation environment characterised by large shocks, the empirical implications of state-dependent pricing for inflation dynamics and the transmission of monetary policy are even more pronounced.
With large inflationary shocks, the frequency of price changes increases, resulting in stronger and faster inflation dynamics. For a given degree of persistence of the underlying cost shocks, inflation will rise more quickly than if the frequency of price changes had remained unaffected. At the same time, the pass-through of the shocks to the aggregate price level will be faster and inflation will return to the central bank’s target more quickly.
Once firms have absorbed the large cost shock into their prices, state dependence implies that the frequency of price adjustment will return to its long-term norm. As price flexibility returns to its pre-shock levels, and if inflation is not expected to stay elevated, a decline in aggregate demand may lead to a slow-down in economic activity rather than lower inflation, since fewer firms respond by reducing prices. As a result, in the absence of further large shocks, the transmission of monetary policy should, all else being equal, more closely reflect the historical patterns prevailing in the pre-pandemic period of stable inflation. For any given change in monetary policy stance, either contractionary or expansionary, its effects on inflation should materialise with lags similar to those seen before the pandemic.
The reset price refers to the new price after a price change.
Menu costs include any costs that occur as a result of a firm changing its prices. For instance, there is empirical evidence that changing prices in supermarkets is a complex process, requiring many steps and a significant amount of resources. See Levy, D., Bergen, M., Dutta, S. and Venable, R., “The Magnitude of Menu Costs: Direct Evidence from Large U. S. Supermarket Chains”, The Quarterly Journal of Economics, Vol. 112, No 3, 1997, pp. 791-825. Specifically, the menu costs documented in this study comprise “(1) the labor cost of changing shelf prices, (2) the costs of printing and delivering new price tags, (3) the costs of mistakes made during the price change process, and (4) the cost of in-store supervision of the price change process”.
The price-gap proxy is constructed as the difference between the price of an item (“barcode”) in a given shop and the average price of the same item in other nearby shops where this price has changed in the same month, after controlling for permanent shop-category differences in prices stemming from variation in market power, geography and amenities. See Karadi, P., Amann, J., Sánchez Bachiller, J., Seiler, P. and Wursten, J., “Price setting on the two sides of the Atlantic – Evidence from supermarket scanner data”, Journal of Monetary Economics, Vol. 140, 2023, pp. S1-S17.
For a textbook exposition, see Gali, J., Monetary Policy, Inflation, and the Business Cycle, Princeton University Press, Princeton, 2015.
In many menu cost models, there is a discrete jump in the probability of price adjustment once the price gap reaches a threshold value. See, for example, Golosov, M. and Lucas Jr., R.E., “Menu Costs and Phillips Curves”, Journal of Political Economy, Vol. 115, No 2, 2007, pp. 117-199.
Using the appropriate weights to aggregate from elementary product categories to aggregate inflation.
Gautier, E. et al., op. cit.
The seasonal patterns in the frequency of price changes would be consistent with the predictions of a class of time-dependent models with some degree of staggering (most evidently, price changes are more frequent in January); they would also be consistent with underlying seasonality in cost changes such as wages, which, under state dependence, would in turn affect frequency.
See Nakamura, E., Steinsson, J., Sun, P. and Villar, D., “The Elusive Costs of Inflation: Price Dispersion during the U.S. Great Inflation”, The Quarterly Journal of Economics, Vol. 133, No 4, 2018, pp. 1933-1980, and Wulfsberg, F., “Inflation and Price Adjustments: Micro Evidence from Norwegian Consumer Prices 1975-2004”, American Economic Journal: Macroeconomics, Vol. 8, No 3, 2016, pp. 175-194.
See Alvarez, F., Beraja, M., Gonzalez-Rozada, M. and Neumeyer, A., “From Hyperinflation to Stable Prices: Argentina’s Evidence on Menu Cost Models”, The Quarterly Journal of Economics, Vol. 134, No 1, 2018, pp. 451-505, and Gagnon, E., “Price Setting during Low and High Inflation: Evidence from Mexico”, The Quarterly Journal of Economics, Vol. 124, No 3, 2009, pp. 1221-1263.
For details on the web-scraped data, see Box 3 in Strasser, G. et al., “E-commerce and price setting: evidence from Europe”, Occasional Paper Series, No 320, ECB, Frankfurt am Main, 2023.
Gautier, E. et al., “New Facts on Consumer Price Rigidity in the Euro Area” American Economic Journal: Macroeconomics, 2024, forthcoming, covers the low inflation period (2000-19) for 11 euro area countries, relying on datasets which together amount to about 130 million price observations collected by national statistical institutes to compute CPIs and HICP.
In the recent data update, the datasets end in December 2023 for Estonia, Spain, Italy and Latvia, October 2023 for Germany and France, and March 2023 for Lithuania (for more details on Lithuania, see Jouvanceau, V., “Consumer price rigidity in a context of low and high inflation: the case of Lithuania”, Discussion Paper Series, No 34, Bank of Lithuania, 2023). The German dataset from January to October 2023 only contains prices collected in the state of Hesse, although these are highly representative of the country as a whole.
For survey evidence on producer price adjustment in France during the high inflation period, see Gautier, E., Le Bihan, H. and Lippi, F., “Why prices transmit large-scale shocks more quickly”, Eco Notepad, No 324, Banque de France, 2023.
Gautier, E. et al., op. cit., 2024, forthcoming.
For more information, see Strasser, G. et al., “E-commerce and price setting: evidence from Europe”, Occasional Paper Series, No 320, ECB, Frankfurt am Main, 2023.
See Dedola, L. et al., “Some implications of micro price-setting evidence for inflation dynamics and monetary transmission”, Occasional Paper Series, No 321, ECB, Frankfurt am Main, 2023.
Notably, Chart B of Box 1 shows that average price increases and decreases in the euro area are around 8% and 10% (in absolute values) respectively.
Petrella, I., Santoro, E., and de la Porte Simonsen, L., “Time-varying Price Flexibility and Inflation Dynamics”, CEPR Discussion Paper, No 13027, Centre for Economic Policy Research, 2018.
State-dependent models predict non-linearities to be symmetric in the sign of the shocks, and there is evidence that, like small inflationary shocks, small deflationary shocks also do not seem to affect the frequency of price changes. However, there is no comparable evidence for large deflationary shocks.
Auclert, A., Rigato, R., Rognlie, M. and Straub, L., “New Pricing Models, Same Old Phillips Curves?”, Quarterly Journal of Economics, Vol. 139, No 1, 2024, pp. 121-186.
The survey was conducted in the context of the ECB’s regular contacts with non-financial firms. For more details, see the article entitled “The ECB’s dialogue with non-financial companies”, Economic Bulletin, Issue 1, ECB, 2021.
See the box entitled “Price-setting behaviour: insights from a survey of large firms”, Economic Bulletin Issue 7, ECB, 2019. Although the samples of firms responding to the two surveys differ, there is some overlap (32 firms responded to both the 2019 survey and the most recent survey). When only the sub-sample of overlapping firms is analysed, all of the results remain consistent.
In 2019 competitors’ prices, costs (non-labour and labour) and demand all ranked among the most important considerations for firms when setting prices. Maintaining profit margins and consumer price inflation were not listed as a response option in 2019.
See the box entitled “Main findings from the ECB’s recent contacts with non-financial companies” in this issue of the Economic Bulletin.