


Published as part of the ECB Economic Bulletin, Issue 3/2024.
Headline and core inflation levels and momentum dynamics in the euro area are currently somewhat weaker than in the United States. Headline inflation has fallen faster and from a higher peak in the euro area than in the United States in annual percentage terms − from 10.6% in October 2022 to 2.6% in February 2024 in the euro area and from 9.1% in June 2022 to 3.2% in February 2024 in the United States.[1] Momentum (measured as annualised three-month-on-three-month growth) is also weaker in the euro area, for both headline inflation and core inflation (Chart A). In both economic blocs, falling energy prices and moderating food inflation have been significant drivers of the decline in headline inflation, while core inflation remains elevated in both economies.[2]
Chart A
Headline and core inflation and their momentum in the euro area and the United States
(annual percentage changes, three-month-on-three-month annualised percentage changes)
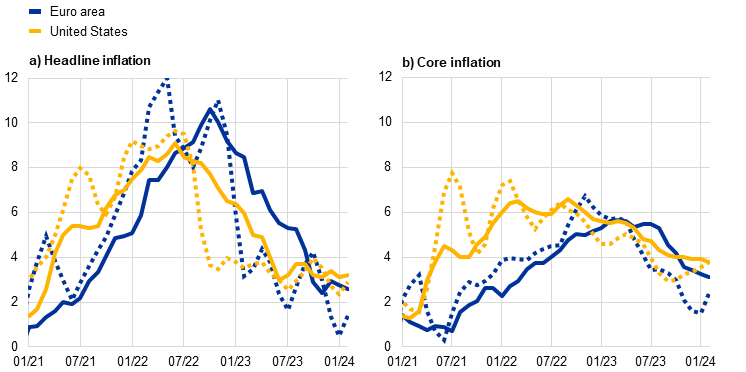
Sources: Eurostat and Bureau of Labor Statistics.
Notes: HICP inflation is reported for the euro area and CPI inflation is reported for the United States. The dotted lines show the momentum. The latest observations are for February 2024.
Services inflation is keeping core inflation elevated in both economic areas. Core inflation in the United States peaked at 6.6% in September 2022 before declining to 3.8% in February 2024. In the euro area, it peaked later, at 5.7% in March 2023, and fell to 3.1% in February 2024. In both economies, core inflation remains persistent, with services inflation acting as the main driver. Over recent years, services inflation has been stronger in the United States than in the euro area (Chart B, panel a). The persistence in the United States is mainly linked to stubbornly high (albeit declining) rent inflation, which is responding only slowly to the significant slowdown of rent inflation in new contracts. Rent inflation accounts for more than half of core services inflation in the United States, making it an important driver of core inflation dynamics. Core services inflation excluding rents currently stands at 4.4%. This is above its pre-pandemic average of around 2% and strongly driven by inflation in the transport and recreation sectors. In the euro area, increases in rents have been more moderate and rent inflation contributes significantly less to services inflation.[3] Services inflation stands at 4.0% (the same when excluding rents), also well above the pre-pandemic average of 1.9%. Tourism and recreation-related (more contact-intensive) services inflation, at 4.5%, is also higher than total services inflation in the euro area, notwithstanding strong declines over the course of 2023.
By contrast, goods inflation has decreased considerably in both economies, with the fall commencing significantly earlier in the United States. Goods inflation has slowed down markedly in both economies in line with the supply chain normalisation at the global level, lower commodity prices and monetary policy tightening (Chart B, panel b). This trend has been reinforced by the shift in consumer spending from goods to services since the start of the post-pandemic reopening. In the United States, the contribution of goods inflation to overall inflation is already slightly negative, in line with pre-pandemic trends. In the euro area, goods inflation is still somewhat higher than its long-term average and than in the United States. This is likely due to a lagged impact of the energy shock following the Russian invasion of Ukraine, which hit the euro area harder, together with differences in the timing of monetary policy tightening.[4]
Chart B
Services and goods inflation and their momentum in the euro area and the United States
(annual percentage changes, three-month-on-three-month annualised percentage changes)

Sources: Eurostat and Bureau of Labor Statistics.
Notes: HICP inflation is reported for the euro area and CPI inflation for the United States. For the euro area, goods inflation refers to non-energy industrial goods. The dotted lines show the momentum. The latest observations are for February 2024.
Measures of underlying inflation have been broadly declining from their respective peaks in both the euro area and the United States (Chart C). These measures, which aim to capture the more persistent component of inflation and relate to the HICP in the euro area and to the personal consumption expenditure (PCE) index in the United States, rose considerably after the coronavirus (COVID-19) pandemic, but began to generally decline in 2023.[5] The range of indicators started crossing the 2% threshold in the last few months. In both economies, the Persistent and Common Component of Inflation (PCCI) measures are at the bottom of the respective ranges. In part, this reflects the fact that the PCCI extracts signals in a more timely manner from monthly price dynamics across many items.[6] In the euro area, the domestic inflation indicator, which includes HICP items with a low import intensity, is currently the highest and most persistent measure, demonstrating the importance of price pressures in the domestic economy, such as wage and profit developments.[7] In the United States, the cyclical core inflation indicator, which tracks price developments in categories sensitive to the unemployment gap, stands at the top of the range after reaching much higher levels than the other underlying inflation measures, likely reflecting still relatively tight labour market conditions in the United States. The Supercore indicator for the euro area, which follows a comparable approach to the US cyclical core inflation indicator, showed similar developments over the last 12 months, but now stands at a lower level, consistent with the weaker demand in the euro area than in the United States.[8]
Chart C
Measures of underlying inflation in the euro area and the United States
(annual percentage changes)

Sources: Eurostat, Haver Analytics, Bureau of Economic Analysis, Federal Reserve Bank of San Francisco, Federal Reserve Bank of Cleveland, Federal Reserve Bank of Dallas, Federal Reserve Bank of New York and ECB staff calculations.
Notes: For the euro area measures, see the box entitled “Underlying inflation measures: an analytical guide for the euro area”, Economic Bulletin, Issue 5, ECB, 2023. The PCCI and the PCCI excluding energy measures for the United States PCE index are estimated using the methodology in Bańbura, M. and Bobeica, E., op. cit. The latest observations are for February 2024. HICPX stands for HICP inflation excluding energy and food.
The euro area and the United States are at different points in the economic cycle, which is contributing to differences in inflation. In the euro area, real GDP remained largely flat over 2023 and the output gap was estimated to be around zero.[9] By contrast, the US economy grew strongly over the same period, particularly in the second half of the year, and the output gap is estimated by most international organisations to have remained in positive territory. Moreover, growth in the United States is supported by buoyant consumption in particular, further contributing to consumer inflation. This contrasts with the anaemic growth in consumption recorded in the euro area. Notwithstanding the differences in the cyclical developments, monetary policy has been effective in cooling inflationary pressures in both economies.[10]
The different cyclical positions of the two economies, as well as institutional factors, are also reflected in the growth of unit labour costs. Unit labour cost growth remains elevated in the euro area, while in the United States it has been moderating since the end of 2022. The difference is being driven by both wages and productivity. Higher unit labour cost growth in the euro area during 2023 reflects both stronger wage growth and weaker productivity developments (Chart D, panel a). By contrast, unit labour cost growth in the United States already started to decrease in 2023 (Chart D, panel b), due to both wage growth moderation and strong productivity dynamics. In addition to cyclical developments, such differences are also attributable to institutional differences in labour markets between the euro area and the United States.
Chart D
Unit labour cost growth and its decomposition in the euro area and the United States
(annual percentage changes)

Sources: Eurostat, Bureau of Economic Analysis and Bureau of Labor Statistics.
Notes: Productivity growth reduces unit labour cost growth, so it appears in the decomposition with an inverted sign. Euro area unit labour cost growth in 2021 was affected by compensation per employee and productivity developments in 2020, reflecting the impact of job retention schemes. The latest observations are for the fourth quarter of 2023.
In the euro area, the pace of wage growth seems to have reached its peak around mid-2023, while in the United States it has been subsiding from high levels since the end of 2022. Wage growth in the euro area picked up from rather subdued levels in early 2021, with employees aiming to recoup purchasing power lost to high inflation amid tight labour markets. It started to ease during 2023, albeit remaining well above past averages. Labour market tightness began to diminish in the United States at the end of 2022, as reflected in a decline in the ratio of vacancies to unemployment, and wage growth subsequently started to subside from high levels. Despite its slow yet steady decline, US wage growth remains above the levels the Federal Reserve System considers compatible with its inflation target.[11] The later peak of wage pressures in the euro area compared with the United States is explained by both cyclical and structural factors. Specifically, a more flexible US labour market makes wage growth more sensitive to changes in labour market tightness.[12] In addition, collective bargaining coverage is higher in the euro area, but so is wage coordination. Wage negotiations mainly take place at the sector level, resulting in a more staggered response of wages to the impact of shocks. By contrast, the predominant firm-level model of wage bargaining in the United States may lead to wages responding faster to prevailing labour market conditions.
In the second half of 2023, labour productivity grew below its pre-pandemic trend in the euro area, while accelerating in the United States. These differences partly reflect both structural and cyclical factors. In terms of structural differences, labour productivity was already growing at a slower rate in the euro area than in the United States before the pandemic. Over the period from 2016 to 2019, the average year-on-year growth rate of productivity was around 0.6% in the euro area and around 1.1% in the United States. The structural differences relate among other factors to the lack of firms at the global technology frontier and the slower diffusion of new technologies, which have led to slower growth of capital stock and total factor productivity in the euro area.[13] On the cyclical side, productivity growth has declined in the euro area − a cyclical behaviour common to the more rigid euro area labour markets where firms tend to hoard labour during times of low or negative GDP growth.[14] By contrast, the above-average labour productivity growth in the United States in the second half of 2023 was driven by exceptionally strong GDP growth. This followed negative productivity growth in 2022 due to the strong recovery in services employment after the post-pandemic reopening of the economy. In the euro area, the projected uptick in GDP growth and a recovery in productivity to levels closer to pre-pandemic trends should support lower unit labour cost growth in the future.
See also the box entitled “Inflation developments in the euro area and the United States”, Economic Bulletin, Issue 8, ECB, 2022.
There are some differences between the euro area and the United States in the classification of certain categories in the inflation statistics. In particular, food services are part of services prices in the euro area and part of food prices in the United States. At the same time, alcoholic beverages and tobacco are included in food prices in the euro area and in goods prices in the United States.
In 2023 the average weight of rents in services core inflation was 57% in the United States – with the rent of primary residence representing 13% while the owners’ equivalent rent reached 44% − and 13% in the euro area. Owners’ equivalent rent is not included in euro area HICP.
The relative weights of goods and services inflation differ in the euro area and the United States, which also contributes to the differences in core inflation. Services make up about 40% of HICP inflation in the euro area and about 60% of CPI in the United States
For the euro area, see the box entitled “Underlying inflation measures: an analytical guide for the euro area”, Economic Bulletin, Issue 5, ECB, 2023. For the United States, underlying inflation measures are based on PCE inflation, the Fed’s preferred measure, rather than CPI inflation.
See Bańbura, M. and Bobeica, M., “PCCI – a data-rich measure of underlying inflation in the euro area”, Statistics Paper Series, No 38, ECB, 2020.
See the box entitled “A new indicator of domestic inflation for the euro area”, Economic Bulletin, Issue 4, ECB, 2022.
The Supercore indicator includes only those items of HICP inflation excluding energy and food (HICPX) that are deemed sensitive to slack, as measured by the output gap. See the article entitled “Measures of underlying inflation for the euro area”, Economic Bulletin, Issue 4, ECB, 2018.
See European Commission European Economic Forecast, Autumn 2023. Source: AMECO database.
In the euro area, model-based evidence confirms a dampening impact of the monetary policy tightening on HICP inflation. See the box entitled “A model-based assessment of the macroeconomic impact of the ECB’s monetary policy tightening since December 2021”, Economic Bulletin, Issue 3, ECB, 2023.
For an analysis of the macroeconomic impact of the Federal Reserve’s latest tightening cycle, see D’Amico, S. and King, T., “Past and Future Effects of the Recent Monetary Policy Tightening”, Chicago Fed Letter, No 483, Federal Reserve Bank of Chicago, September 2023, and Crump, R., Del Negro, M., Dogra, K., Gundam, P., Lee, D., Nallamotu, R. and Pacula, B., “A Bayesian VAR Model Perspective on the Lagged Effect of Monetary Policy”, Liberty Street Economics, Federal Reserve Bank of New York, 21 November 2023.See, for example, the opening remarks by Chair Powell at Spelman College on 1 December 2023.
See the box entitled “Labour market developments in the euro area and the United States in 2022”, Annual Report, ECB, 2022, and the box entitled “Comparing labour market developments in the euro area and the United States and their impact on wages” in “Wage developments and their determinants since the start of the pandemic”, Economic Bulletin, Issue 8, ECB, 2022.
See, for instance, the box entitled “Firm productivity dynamism in the euro area”, Economic Bulletin, Issue 1, ECB, 2022.
See also Arce, O., Consolo, A., Dias da Silva, A. and Mohr, M., “More jobs but fewer working hours”, The ECB Blog, 7 June 2023.